- Mark as New
- Bookmark
- Subscribe
- Mute
- Subscribe to RSS Feed
- Permalink
- Report Inappropriate Content
Hi,
Pasting an excerpt from the vtune user guide
If the VTune Profiler does not find debug information for the binaries, it statically identifies function
boundaries and assigns hotspot addresses to generated pseudo names func@address for such functions, for
example:
How are the host spot addresses "assigned". Are these virtual addresses?
To give some context, we are trying to match the hot function addresses against virtual addresses printed with other tools to find out if the hot functions are really in the critical path or not. The address ranges printed by vtune dont seem to match other tools so I wanted to understand how vtune is assigning addresses to functions.
Thanks!
Link Copied
- Mark as New
- Bookmark
- Subscribe
- Mute
- Subscribe to RSS Feed
- Permalink
- Report Inappropriate Content
Hi,
Thanks for posting in Intel Communities.
Can you try compiling the binary application with the -g option so debugging information are included in the DWARF format. This can be used by VTune to correctly assign function names.
We are also checking with the development team for better documentation to answer your queries. We will get back to you with updates shortly.
Regards,
Sreedevi
- Mark as New
- Bookmark
- Subscribe
- Mute
- Subscribe to RSS Feed
- Permalink
- Report Inappropriate Content
Hi,
Intel VTune Profiler is a statistical sampler tool. Based on the sampling interval, Intel VTune Profiler resolves the current CS:EIP for each core to the source code at the time of the sampling interval interrupt. To enhance the ability to correctly resolve the addresses, you can refer to below guide:
For better accuracy, you can also try with small sample interval(<1ms and call stack collection disabled to reduce overhead) and also try specifying the binary and source search directories during collection and finalization properly to locate supporting files and display analysis information in relation to your source code.
Reference: https://www.intel.com/content/www/us/en/docs/vtune-profiler/user-guide/2023-2/search-directories.html)
If you need any further clarifications, please let us know.
Regards,
Sreedevi
- Mark as New
- Bookmark
- Subscribe
- Mute
- Subscribe to RSS Feed
- Permalink
- Report Inappropriate Content
Thanks for your response. Resolving addresses using symbols will not be possible for us at the moment. We have to rely on addresses to identify functions. We are using 1ms sampling interval with Call Stacks disabled (default Microarchitectural Exploration configuration).
Are there any insights on how the highlighted address is generated in vtune? How do we get the Relative Virtual Address in the binary for this function
- Mark as New
- Bookmark
- Subscribe
- Mute
- Subscribe to RSS Feed
- Permalink
- Report Inappropriate Content
Hi,
We have checked with our engineering team on your query and they have provided us the below suggestions:
1.To configure search directories in the VTune GUI, please refer:
(Note: when you collect data from a remote Linux system, try to copy the source and binaries of interest to your local Windows drive and add those locations to the search directories in the VTune GUI.)
2.To configure search directories in the VTune CLI, you can refer to https://www.intel.com/content/www/us/en/docs/vtune-profiler/user-guide/2023-2/specifying-search-directories.html
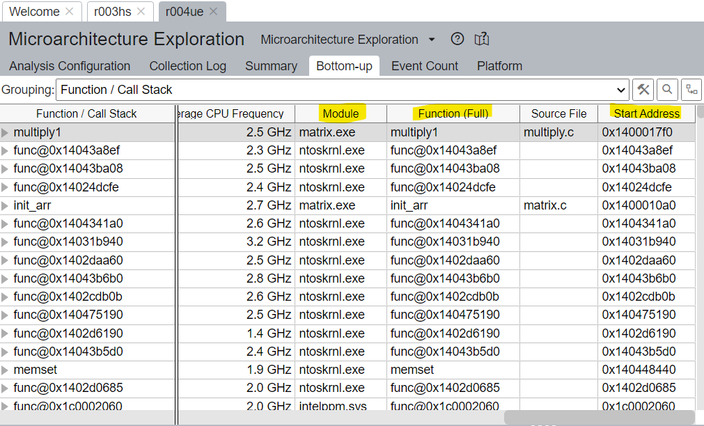
3. In the VTune GUI Bottom-up tab display, scrolling right in the middle pane should show the module and function offset (address).
For example:
4. For a description of VTune's sampling method, you can refer to first two paragraphs of https://www.intel.com/content/www/us/en/docs/vtune-profiler/user-guide/2023-2/user-mode-sampling-and-tracing-collection.html and https://www.intel.com/content/www/us/en/docs/vtune-profiler/user-guide/2023-2/sep-driver.html
Hope this will help in clarifying your query. If you need any further help, please let us know.
Regards,
Sreedevi
- Mark as New
- Bookmark
- Subscribe
- Mute
- Subscribe to RSS Feed
- Permalink
- Report Inappropriate Content
Hi,
We have not heard back from you. Could you please give us an update? Is your issue resolved?
Regards,
Sreedevi
- Mark as New
- Bookmark
- Subscribe
- Mute
- Subscribe to RSS Feed
- Permalink
- Report Inappropriate Content
Hi,
We have not heard back from you. This thread will no longer be monitored by Intel. If you need further assistance, please post a new question.
Regards,
Sreedevi
- Subscribe to RSS Feed
- Mark Topic as New
- Mark Topic as Read
- Float this Topic for Current User
- Bookmark
- Subscribe
- Printer Friendly Page

