- Mark as New
- Bookmark
- Subscribe
- Mute
- Subscribe to RSS Feed
- Permalink
- Report Inappropriate Content
Previous post :
Current context :
We are using VTune profiler version 2020 Update 2
- And we are trying to capture a Hotspot analysis to identify the possible reasons for High CPU Usage in the previously mentioned thread. We did setup the Custom Analysis. We are using the VTune installed in a Windows Server and connecting to a Linux Server through SSH option. The Linux sever[Rhel 7.6] is our target. We are able to collect performance-snapshot and system-overview samples by attaching PID through the WHAT option. But when we try to capture the hotspot analysis, we end up having the error due to PIN_MAX_THREADS. Can you please let us know if this can be bypassed. Screenshot attached. We have a fairly large process with almost more than 60% use in each CPU core we are using.
- When we try to compare results of 2 system-overview captures, we don't see the data from the 2nd capture as shown in the screenshot. But if we open it manually, we see all data. The problem is only while comparison. Any suggestions from your end ?
Thanks
Arnab
Link Copied
- Mark as New
- Bookmark
- Subscribe
- Mute
- Subscribe to RSS Feed
- Permalink
- Report Inappropriate Content
Hi.
Could you try Hardware based Hotspots with and without stacks?
- Mark as New
- Bookmark
- Subscribe
- Mute
- Subscribe to RSS Feed
- Permalink
- Report Inappropriate Content
Hi,
Thanks for the information. We were able to capture hotspots with Hardware Events-Based Sampling. And we are able to look into results singularly.
We captured 2 samples while the CPU usage was higher and lower. But while comparing the samples, we still face a problem . In the attached screenshot, we try to compare r007hs and r009hs. But the data tables of r009hs come up blank.
Are we doing it the right way or there is something else that needs to be done. Any Suggestions on that.
Thanks & Regards
- Mark as New
- Bookmark
- Subscribe
- Mute
- Subscribe to RSS Feed
- Permalink
- Report Inappropriate Content
Hi,
As I have mentioned previously that we have been able to capture Hardware based hotspots and we are trying to analyze the sample.
We found that the same section of code is utilizing different amount of CPU time after the process if getting executed for 1 hour or a little more. Until then, the CPU usage is higher.
And we need a little help from you regarding what can be the possible cause for the same. I am attaching the assembly analysis screenshot from when the CPU usage is higher and low. It includes the CPU time and the instructions retired numbers.
Can you please help us little on the possible reason for the same.
Thanks and Best Regards.
- Mark as New
- Bookmark
- Subscribe
- Mute
- Subscribe to RSS Feed
- Permalink
- Report Inappropriate Content
Hi.
Could you try 'hardware threading' and 'system overview' analysis?
Probably there are some thread preemptions on this thread. Maybe some another activity on the system - swapping and so on.
Thanks, Kirill
- Mark as New
- Bookmark
- Subscribe
- Mute
- Subscribe to RSS Feed
- Permalink
- Report Inappropriate Content
Hi,
We captured System Overview and Threading as you recommended. And we did see very similar results over there as well. We only see the difference in CPU usage after only about 1-2 hours of usage. not before that. So we captured the System Overview and Threading respectively when the CPU usage was higher and lower. I have mentioned the details as follows for the recommended captures.
Please let us know your suggestions/recommendations.
System Overview : I am attaching the results which are comparable as high and low cpu usage. Between the System_Overview_High_CPU and System_Overview_Low_CPU, we see a marked difference in 1901 source line. Yet both the captures are for 30 seconds. Please check the attached screenshots.
Threading : Between the captures Threading_High_CPU and Threading_Low_CPU, here too we see a marked difference between CPU Utilization for the 1901 source line. This capture for high and low cpu usage is also for 30 seconds.
Thanks & Best Regards
- Mark as New
- Bookmark
- Subscribe
- Mute
- Subscribe to RSS Feed
- Permalink
- Report Inappropriate Content
Hi,
Is it possible to share 'System Overview' low and fast results?
Kirill
- Mark as New
- Bookmark
- Subscribe
- Mute
- Subscribe to RSS Feed
- Permalink
- Report Inappropriate Content
Hi,
Can you please let me know if any specific extract from the "System Overview" capture you want to be shared ? Because the whole "System Overview" capture is of size more than 1.2 GB.
If any specific data can be extracted and shared please let me know.
Thanks & Best Regards
- Mark as New
- Bookmark
- Subscribe
- Mute
- Subscribe to RSS Feed
- Permalink
- Report Inappropriate Content
I'm not in context of your application but try to describe some example.
First of all I suggest to wrap your function/source of code by tasks
That gives us the picture how many times your code is called in both cases fast and slow. Also, how long the call takes.
Also, you could see the time points on the timeline and correlate this time with another activity on the system. For example, swapping produces some io data transfer activity and so on.
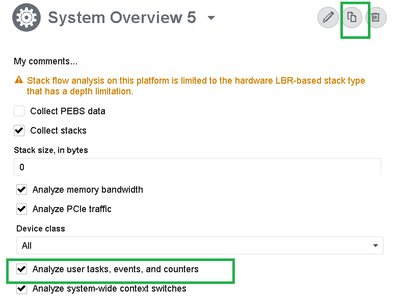
To enable task collection in system overview you need to create custom analysis and set checkbox
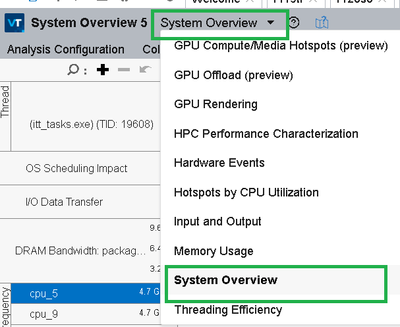
when the collection finish, just change viewpoint on System Overview
- Mark as New
- Bookmark
- Subscribe
- Mute
- Subscribe to RSS Feed
- Permalink
- Report Inappropriate Content
Hi @Kirill_U_Intel ,
Thank you very much for the information regarding the tasks. We will try that in custom analysis and let you know.
In the meantime, since we already have successfully captured system_overview and hotspots data, and we have identified a few areas, we wanted to capture the memory_access and Microarchitecture analysis.
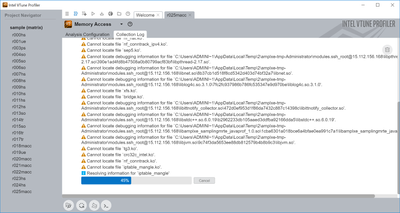
But we faced a bit of road-block over there. In both memory_access and microarchitecture, during the capture, the analysis stopped at 45% and did not move forward for hours and pointed to some missing files regarding iptables. Is there any dependency of iptables with these 2 captures ?
I am attaching the screengrabs. Now this is the same setup in which we successfully captured hotspots, system_overview and threading without this problem.
We have iptables installed in our setup but iptables-services is not installed. And all iptables rules are flushed. Also firewalld service is not running.
Thanks & Best Regards
- Mark as New
- Bookmark
- Subscribe
- Mute
- Subscribe to RSS Feed
- Permalink
- Report Inappropriate Content
Hi.
Is it reproduce on shot 1 seconds collection?
Unfortunately we could not resolve that hang without reproducer on our side.
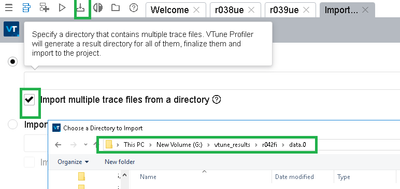
Could you try to import collected results? Is it hang again?
Kirill
- Mark as New
- Bookmark
- Subscribe
- Mute
- Subscribe to RSS Feed
- Permalink
- Report Inappropriate Content
Hi,
- We are only facing this on new captures. Opening/importing the problematic results also resulted in hang.
- All the older successful captures are opening fine. We can still open them and check properly.
- Tried a short 1 second Memory Access capture as suggested and observed same problem over there too. Screenshot attached.
- We are investigating from our end for all possible reasons. Please let me know if you have any inputs/suggestions. Also if any information regarding configuration is available, please suggest us.
Thanks & Best Regards.
- Mark as New
- Bookmark
- Subscribe
- Mute
- Subscribe to RSS Feed
- Permalink
- Report Inappropriate Content
- Mark as New
- Bookmark
- Subscribe
- Mute
- Subscribe to RSS Feed
- Permalink
- Report Inappropriate Content
Hi,
As we try to rectify the problem with current captures, we analyzed a bit more on the captures that we already had.
Analyzing a bit more we got a lot of system calls as well as JVM calls and a lot more which are using a little less CPU time for similar sized captures while our CPU usage is high and low respectively.
I am attaching an excel file for that highlighting the differences. Got the data from VTune hotspots capture. Please let me know if you can shed a little more light on what can be the possible reasons for the same.
Thanks & Best Regards,
Arnab
- Mark as New
- Bookmark
- Subscribe
- Mute
- Subscribe to RSS Feed
- Permalink
- Report Inappropriate Content
Hi @Kirill_U_Intel ,
1 quick question. Does VTune has any compatibility issues with Linux KVM/VM ? We were able to do a setup in a bare-metal server. But the remote configuration is not going through for for a RHEL7 VM. It is in kind of a freeze state.
Thanks & Regards,
Arnab
- Mark as New
- Bookmark
- Subscribe
- Mute
- Subscribe to RSS Feed
- Permalink
- Report Inappropriate Content
Hi.
Did you try to run profiling inside KVM? I'm not sure that hardware collections are available in this case.
Kirill
- Subscribe to RSS Feed
- Mark Topic as New
- Mark Topic as Read
- Float this Topic for Current User
- Bookmark
- Subscribe
- Printer Friendly Page


