- Mark as New
- Bookmark
- Subscribe
- Mute
- Subscribe to RSS Feed
- Permalink
- Report Inappropriate Content
Dear experts,
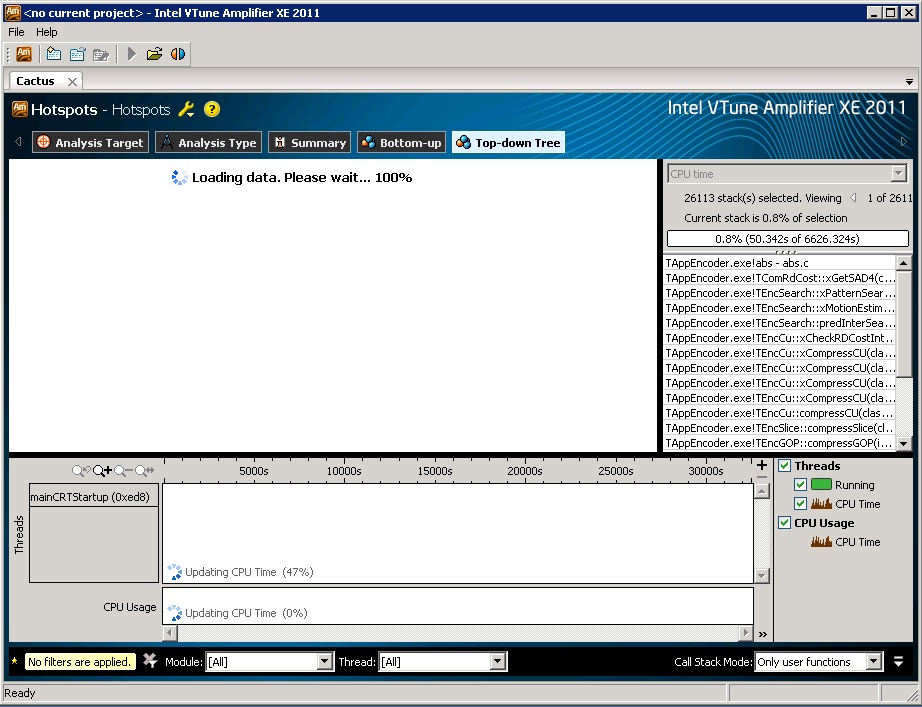
With the Bottom-up option, the results are shown about 10 seconds after selecting it. With the Top-down Tree option, I have already trying let it load for 10 hoursand nothing happens. It keeps loading forever ("Loading data. Please wait... 100%").
Please, check the two attached images. The first one is the Bottom-up visualization. The second one is the Top-down Tree visualization.
I have collected data using the following command line:
Best regards,
Link Copied
- Mark as New
- Bookmark
- Subscribe
- Mute
- Subscribe to RSS Feed
- Permalink
- Report Inappropriate Content
- Mark as New
- Bookmark
- Subscribe
- Mute
- Subscribe to RSS Feed
- Permalink
- Report Inappropriate Content
Are you running with Intel
VTune Amplifier XE for Windows* Update 7?
If not, you may wish to attempt with the latest update which you can
obtain from the Intel Registration Center at https://registrationcenter.intel.com
after logging in. If the behavior
persists, then we may need to know more about the application being analyzed
and the Amplifier XE project settings, duration of the analysis, gather
information about your system, and such.
Does the behavior occur when analyzing other applications such as the
Tachyon sample app? This type of
information will help us provide scope to the issue and come to resolution. We can also look at the results directory for
the analysis that is not displaying in the top-down tab. If you zip and attach a results directory,
you may wish to mark the post to this forum as private.
- Rob
- Mark as New
- Bookmark
- Subscribe
- Mute
- Subscribe to RSS Feed
- Permalink
- Report Inappropriate Content
- Subscribe to RSS Feed
- Mark Topic as New
- Mark Topic as Read
- Float this Topic for Current User
- Bookmark
- Subscribe
- Printer Friendly Page