- Mark as New
- Bookmark
- Subscribe
- Mute
- Subscribe to RSS Feed
- Permalink
- Report Inappropriate Content
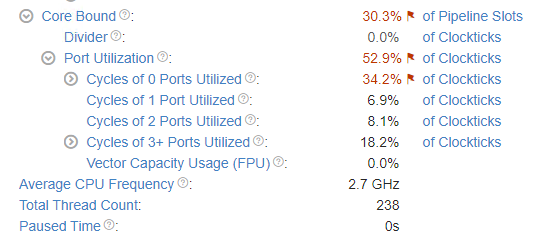
Looking at the port utilization part of the summary of microarchitecture exploration results, I have some questions that would like to have anyone help clarify:
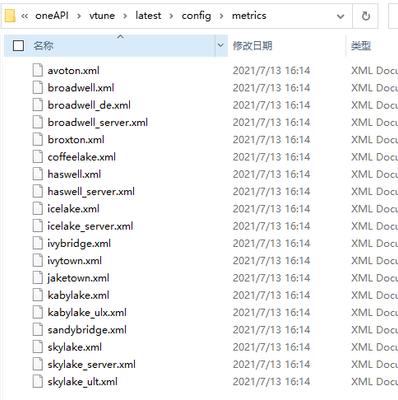
Q1: How VTune calculate the "Cycles of # Ports Utilized"? What the formula is? I can find the some of the metrics formula in the VTuneInstallationDir/config/metrics, but all the XML does not show how the "Cycles of # Ports Utilized" is calculated.
Q2: Why does it not equals to 100% by adding all the sub-metrics under "Port Utilization" such as "Cycles of 0 Ports Utilized", "Cycles of 1 Ports Utilized", "Cycles of 2 Ports Utilized", "Cycles of 3+ Ports Utilized", "FPU" in my analyzed application?
Thank you!
- Mark as New
- Bookmark
- Subscribe
- Mute
- Subscribe to RSS Feed
- Permalink
- Report Inappropriate Content
The formulas depend on CPU, for example on Icelake they are following:
Ports_Utilized_0 = ( CYCLE_ACTIVITY.STALLS_TOTAL - CYCLE_ACTIVITY.STALLS_MEM_ANY ) / CLKS
Ports_Utilized_1 = EXE_ACTIVITY.1_PORTS_UTIL / CLKS
Ports_Utilized_2 = EXE_ACTIVITY.2_PORTS_UTIL / CLKS
Ports_Utilized_3m = UOPS_EXECUTED.CYCLES_GE_3 / CLKS
As you can see from Ports_Utilized_0 formula it tries to subtract memory related stalls - this is the main reason why these metrics do not sum up to 100%, they sum up to parent 'Port Utilization' instead. And this makes sense since we are in Core Bound sub-tree and should concentrate on execution performance issues rather than memory ones.
Link Copied
- Mark as New
- Bookmark
- Subscribe
- Mute
- Subscribe to RSS Feed
- Permalink
- Report Inappropriate Content
The formulas depend on CPU, for example on Icelake they are following:
Ports_Utilized_0 = ( CYCLE_ACTIVITY.STALLS_TOTAL - CYCLE_ACTIVITY.STALLS_MEM_ANY ) / CLKS
Ports_Utilized_1 = EXE_ACTIVITY.1_PORTS_UTIL / CLKS
Ports_Utilized_2 = EXE_ACTIVITY.2_PORTS_UTIL / CLKS
Ports_Utilized_3m = UOPS_EXECUTED.CYCLES_GE_3 / CLKS
As you can see from Ports_Utilized_0 formula it tries to subtract memory related stalls - this is the main reason why these metrics do not sum up to 100%, they sum up to parent 'Port Utilization' instead. And this makes sense since we are in Core Bound sub-tree and should concentrate on execution performance issues rather than memory ones.
- Mark as New
- Bookmark
- Subscribe
- Mute
- Subscribe to RSS Feed
- Permalink
- Report Inappropriate Content
Hi,
Adding to the above comment
Metrics measured in Clockticks are less precise compared to the metrics measured in Pipeline Slots since they may overlap and their sum at some level does not necessarily match the parent metric value. But such metrics are still useful for identifying the dominant performance bottleneck in the code.
For more information please refer:
Regards
Abhijeet
- Mark as New
- Bookmark
- Subscribe
- Mute
- Subscribe to RSS Feed
- Permalink
- Report Inappropriate Content
- Mark as New
- Bookmark
- Subscribe
- Mute
- Subscribe to RSS Feed
- Permalink
- Report Inappropriate Content
Hi,
Thanks for the confirmation.
If you need any additional information, please submit a new question as this thread will no longer be monitored.
Regards
Abhijeet
- Subscribe to RSS Feed
- Mark Topic as New
- Mark Topic as Read
- Float this Topic for Current User
- Bookmark
- Subscribe
- Printer Friendly Page

