- Mark as New
- Bookmark
- Subscribe
- Mute
- Subscribe to RSS Feed
- Permalink
- Report Inappropriate Content
Hi,
I ran the latest version of Platform Profiler and uploaded the result file to the platform profiler webpage (localhost:6543).
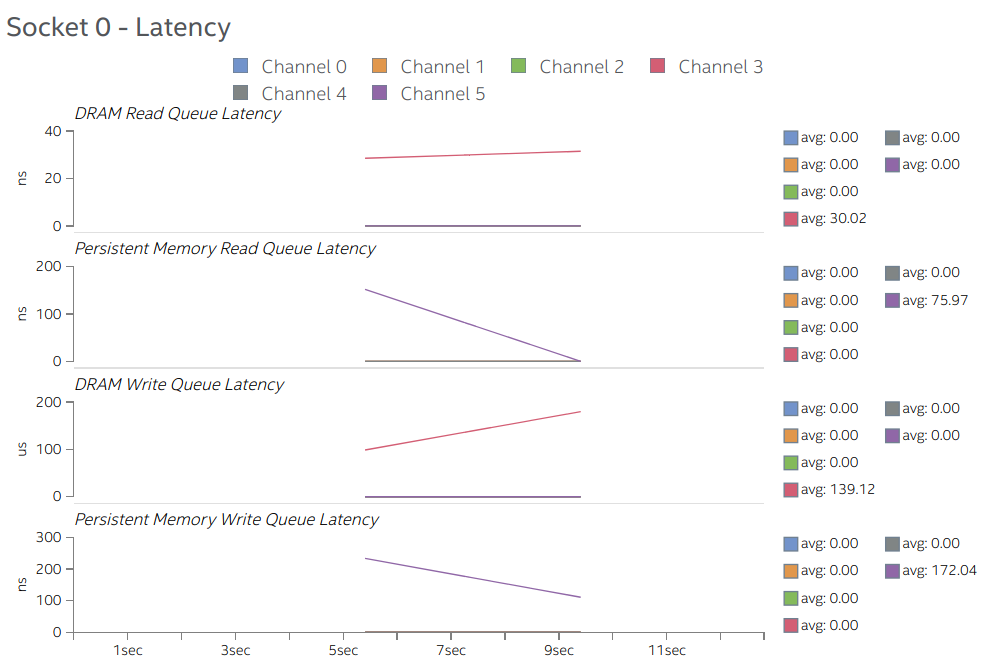
In Memory view, I can see the 'DRAM Write Queue Latency' graph in 'Socket 0 - Latency'.
The graph shows the DRAM write queue latency over the elapsed time, but the data is too coarse to check the tail latency. I think the sampling rate of measurement is too low.
So, how can I check the all latency information about memory accesses? Is there any way to measure it using Vtune Profiler or Platform Profiler or other tools?
Especially, I am interested in write tail latency of Optane DCPMM. I found the 'Persistent Memory Write Queue Latency' graph in the result of Platform Profiler, but the Platform Profiler only shows me the sampled data. I want all data measured by hardware performance counters.
This picture is an example graph showed by platform profiler. But the sampling rate of the graph is too low.
Best regards,
Minjae Kim
Link Copied
- Mark as New
- Bookmark
- Subscribe
- Mute
- Subscribe to RSS Feed
- Permalink
- Report Inappropriate Content
Hey Minjae Kim,
We are forwarding your case to Subject Matter Experts. They will soon get back to you on this.
Arun Jose
- Mark as New
- Bookmark
- Subscribe
- Mute
- Subscribe to RSS Feed
- Permalink
- Report Inappropriate Content
Please use VTune Memory Access analysis for more precise latency analysis.
- Subscribe to RSS Feed
- Mark Topic as New
- Mark Topic as Read
- Float this Topic for Current User
- Bookmark
- Subscribe
- Printer Friendly Page
