- Mark as New
- Bookmark
- Subscribe
- Mute
- Subscribe to RSS Feed
- Permalink
- Report Inappropriate Content
Hi,
I just bought the Intel studio 2015 cluster edition windows. I need to do Basic hotshot profile with intel 2015 + VS 2012 + MPI for my cfd code. I am using a workstation with 2 cpu (2x12 cores). Using 1 cpu, I managed to the analysis successfully.
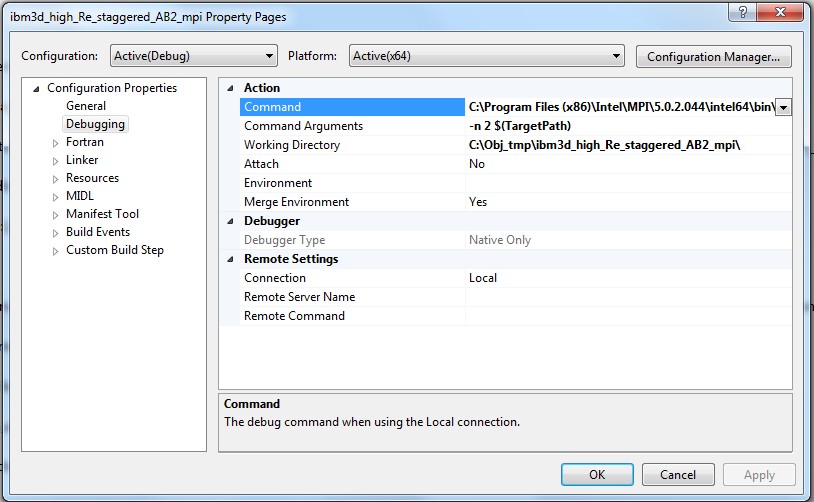
I can run my code in parallel using intel's wmpiexec.exe. I can also run my code thru VS 2012 by:
setting the launch command (Configuration Properties - Debugging - Command) to the full path for mpiexec.smpd.exe (eg C:\Program Files (x86)\MPICH2\bin\mpiexec.exe)
setting the arguments (Configuration Properties - Debugging - Command Arguments) to -n xxx $(TargetPath) where xxx is the no. of cpu
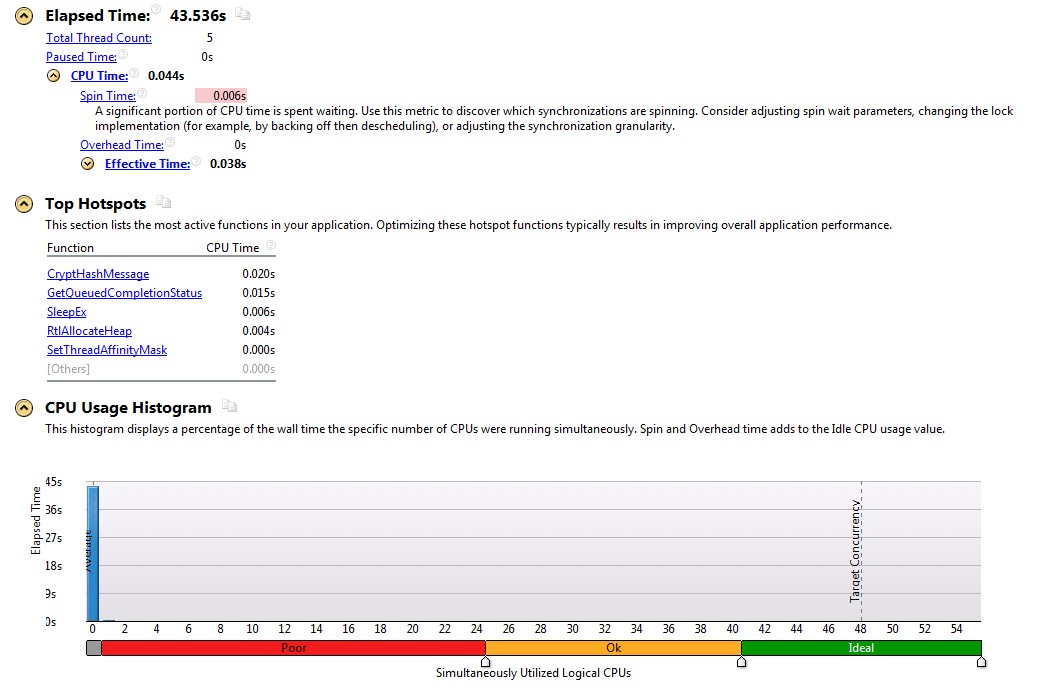
However, I can't get it to work with vtune if I need to use more than 1 core.
It gives the wrong function for top hotspots and my cpu usage is 0.
Any solution?
Thanks!
Link Copied
- Mark as New
- Bookmark
- Subscribe
- Mute
- Subscribe to RSS Feed
- Permalink
- Report Inappropriate Content
Hello,
Could you please provide VTune command line or GUI project properties parameters on how do you launch VTune collection? Or you invoke it in VS?
Thanks & Regards, Dmitry
- Mark as New
- Bookmark
- Subscribe
- Mute
- Subscribe to RSS Feed
- Permalink
- Report Inappropriate Content


- Subscribe to RSS Feed
- Mark Topic as New
- Mark Topic as Read
- Float this Topic for Current User
- Bookmark
- Subscribe
- Printer Friendly Page