- Mark as New
- Bookmark
- Subscribe
- Mute
- Subscribe to RSS Feed
- Permalink
- Report Inappropriate Content
Hi amazing support :-)
I have a question. Does Intel VTune profiler gives an option to see the time per call....I mean time per function call... 'time in sec' spent in each function. Is there any option that can be used in the command window, that would help me know the time, in seconds, spent in each function in my C ++ application?
Thanks in advance !
- Mark as New
- Bookmark
- Subscribe
- Mute
- Subscribe to RSS Feed
- Permalink
- Report Inappropriate Content
I am not sure if this answers the original question....
VTune will certainly show an estimate of the total time spent executing a function, but I don't think that it tracks the number of times the function was called while the measurements were occurring. Since VTune uses a "sampling" methodology, a particular function will be sampled 0, 1, or more times per function execution -- mostly depending on how long the function executes.
If you run the measurements for the duration of the program execution and happen to know how many times the function was called, then you can divide the estimated total time for the function from VTune by the number of executions that you think happened to get the average time per function invocation.
The Intel C compiler has an option "-finstrument-functions" to generate "wrapper" calls at the entry and exit of each function. These can be used to collect statistics on function calls, including timers or performance counters, and provide both the function address and the call site address so that you can build call trees. This instrumentation disables function inlining, unless you instrument a function with a magical "__attribute__((__no_instrument_function__))" annotation. In that case the function will be eligible for inlining, but inlined copies will not generate instrumentation calls.....
Link Copied
- Mark as New
- Bookmark
- Subscribe
- Mute
- Subscribe to RSS Feed
- Permalink
- Report Inappropriate Content
Hey Bobby,
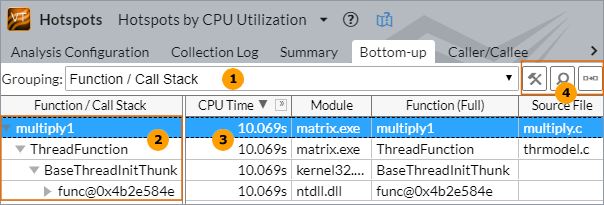
You can run vtune hotspot analysis for viewing time per function. Time per function can be seen in the bottom-up as well as caller callee pane of the vtune report generated. You can find more information regarding running hotspot analysis in the below link.
https://software.intel.com/en-us/vtune-help-running-basic-hotspots-analysis-from-the-command-line
After performing an analysis via the command line, you can view command line results in the GUI to get full benefits of VTune Profiler GUI tools, or you can view a report from the command line. A variety of report types, filtering and formatting options are available. Please visit the below link for more details on generating command line reports
https://software.intel.com/en-us/vtune-help-generating-command-line-reports
Arun Jose
- Mark as New
- Bookmark
- Subscribe
- Mute
- Subscribe to RSS Feed
- Permalink
- Report Inappropriate Content
Hi Arun,
Thanks for the helping reply....Is it also possible to view time per function straight from the GUI? Or one has to use command line always?
- Mark as New
- Bookmark
- Subscribe
- Mute
- Subscribe to RSS Feed
- Permalink
- Report Inappropriate Content
Hey Bobby,
It is possible to see the time per function from the GUI
Arun Jose
- Mark as New
- Bookmark
- Subscribe
- Mute
- Subscribe to RSS Feed
- Permalink
- Report Inappropriate Content
Hi, Bobby.
You could open bottom-up pane for hotspot analysis view, for example
https://software.intel.com/en-us/vtune-help-window-bottom-up

- Mark as New
- Bookmark
- Subscribe
- Mute
- Subscribe to RSS Feed
- Permalink
- Report Inappropriate Content
Hi Bobby,
Hope that answers your query . Could you please confirm if we could close this case.
Arun Jose
- Mark as New
- Bookmark
- Subscribe
- Mute
- Subscribe to RSS Feed
- Permalink
- Report Inappropriate Content
I am not sure if this answers the original question....
VTune will certainly show an estimate of the total time spent executing a function, but I don't think that it tracks the number of times the function was called while the measurements were occurring. Since VTune uses a "sampling" methodology, a particular function will be sampled 0, 1, or more times per function execution -- mostly depending on how long the function executes.
If you run the measurements for the duration of the program execution and happen to know how many times the function was called, then you can divide the estimated total time for the function from VTune by the number of executions that you think happened to get the average time per function invocation.
The Intel C compiler has an option "-finstrument-functions" to generate "wrapper" calls at the entry and exit of each function. These can be used to collect statistics on function calls, including timers or performance counters, and provide both the function address and the call site address so that you can build call trees. This instrumentation disables function inlining, unless you instrument a function with a magical "__attribute__((__no_instrument_function__))" annotation. In that case the function will be eligible for inlining, but inlined copies will not generate instrumentation calls.....
- Mark as New
- Bookmark
- Subscribe
- Mute
- Subscribe to RSS Feed
- Permalink
- Report Inappropriate Content
Hi Bobby,
Hope that answers your query. Could you please confirm if we could close this case.
Arun Jose
- Mark as New
- Bookmark
- Subscribe
- Mute
- Subscribe to RSS Feed
- Permalink
- Report Inappropriate Content
Hi Bobby,
We are closing this case assuming the solution provided helps. Please feel free to raise a new thread in case of further issues.
Arun Jose
- Subscribe to RSS Feed
- Mark Topic as New
- Mark Topic as Read
- Float this Topic for Current User
- Bookmark
- Subscribe
- Printer Friendly Page
