- 新着としてマーク
- ブックマーク
- 購読
- ミュート
- RSS フィードを購読する
- ハイライト
- 印刷
- 不適切なコンテンツを報告
Hi,
Please find below a short update on VTune Amplifier product development.
We continue being focused on various I/O aspects. Our new cookbook recipe IO Issues: High Latency and Low PCIe Bandwidth might help you identify and fix storage issues. Stay tuned for the “SPDK performance analysis with Intel® VTune™ Amplifier” article coming soon.:)
Also, we implemented a technology for .NET* Core dynamic code profiling in VTune Amplifier. It was announced on MSFT blog and we published a new “Profiling a .NET* Core Application” recipe in our cookbook.
In addition to that, we are working on the analysis of user space activity inside KVM virtual machine from the host. This is an important step to implement a VNF (Virtualized Network Functions) profiling capability.
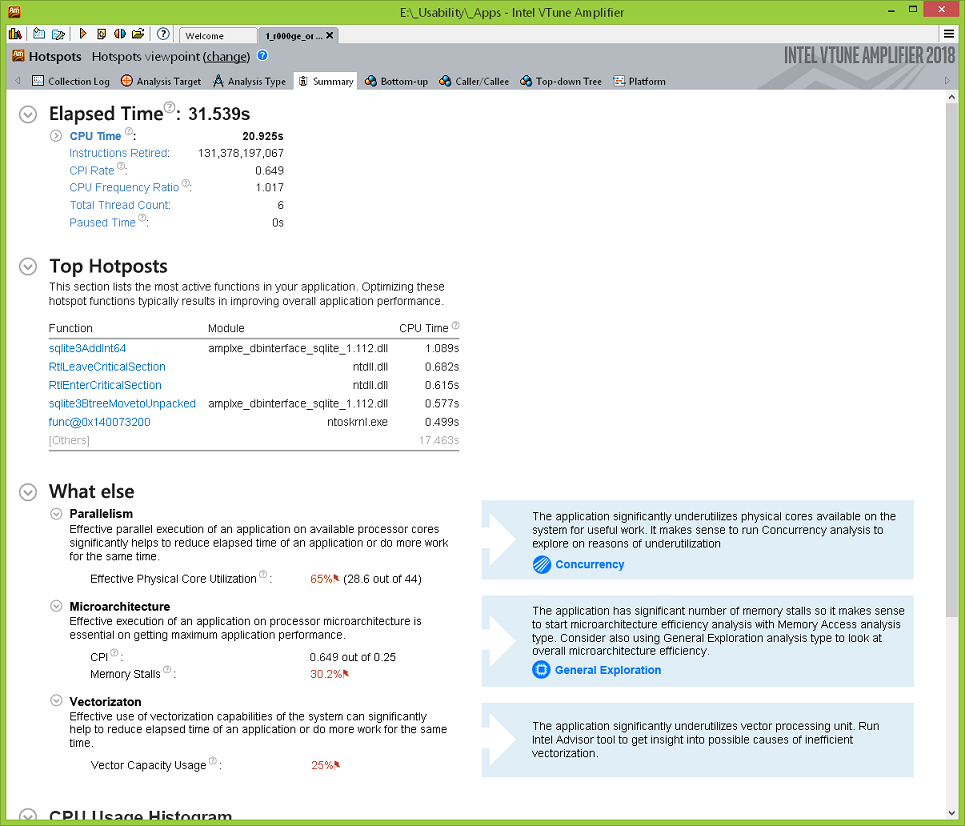
As part of usability improvements, we consider adding an “entry point analysis” to help navigate you thru the tuning flow. The idea is to detect the most obvious issues of the app performance (dominant hotspots, poor core utilization, high CPI) and provide guidance for in-depth analysis or tuning advice. The performance statistics and insight of such an analysis may look as follows
So, a (traditional :) ) question to you:
Would it be helpful or just annoying?
Grateful in advance for the response,
Valery
コピーされたリンク
