
- Mark as New
- Bookmark
- Subscribe
- Mute
- Subscribe to RSS Feed
- Permalink
- Report Inappropriate Content
I'm using VTune Update 15 to profile the benchmark 401.Bzip2 from SPEC CPU 2006 benchmark suite, however I'm seeing a strange result when inspecting the source code to check which instructions are more time consuming. I really don't know how the result I'm seeing can be correct.
The problem is:
1) I use Advanced Hotspot Analysis to profile the code;
2) I go to the "Top-down Tree" tab and expand the main function; Which I see that is running for ~86s and is calling to other functions: spec_compress and spec_uncompress; So I double-click on the main function to check its source code;
3) Inspecting the source code of the main function I note that VTune claims that the line "spec_fd[1].limit=compressed_size*MB;" is executing for ~86s... the total execution time of the benchmark; I also note that in the lines corresponding to the invocations of the functions spec_compress/uncompress the Cpu time is shown as zero.
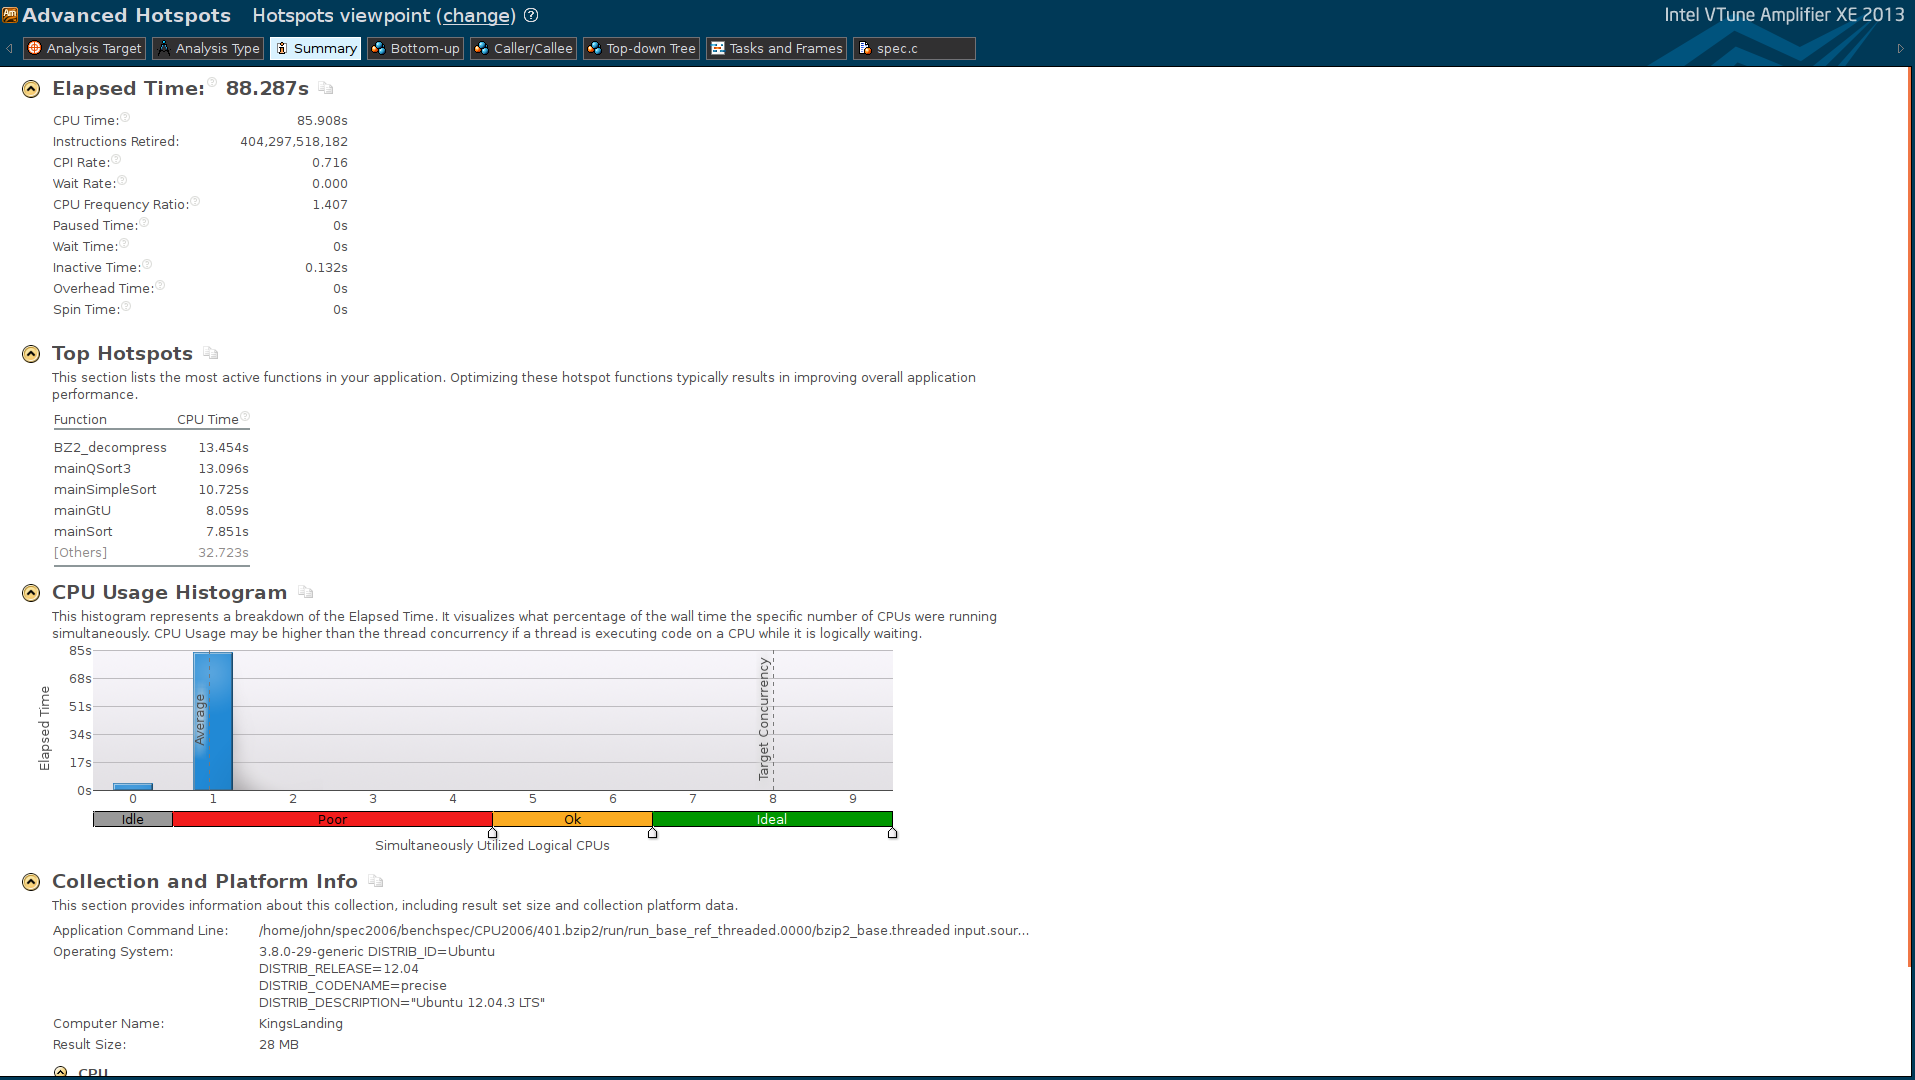
I've attached some screenshots. I would greatly appreciate any help on this!

- Mark as New
- Bookmark
- Subscribe
- Mute
- Subscribe to RSS Feed
- Permalink
- Report Inappropriate Content
Hi Divino:
Did you build with optimizations turned on? Did you view the assembly code for the function in question (i.e., while in the source view)? Optimization changes code layout (inlining, etc.) and I suggest viewing the assembly with the collected data (see Assembly button in upper left of source view).
Link Copied
- Mark as New
- Bookmark
- Subscribe
- Mute
- Subscribe to RSS Feed
- Permalink
- Report Inappropriate Content
Hi Divino:
Did you build with optimizations turned on? Did you view the assembly code for the function in question (i.e., while in the source view)? Optimization changes code layout (inlining, etc.) and I suggest viewing the assembly with the collected data (see Assembly button in upper left of source view).
- Mark as New
- Bookmark
- Subscribe
- Mute
- Subscribe to RSS Feed
- Permalink
- Report Inappropriate Content
Hello Mr. Anderson, how are you?
Yes, I profiled an optimized code.. It seems that the optimization was exactly the source of the problem. Thanks for reminding me of this issue.
So, if I want VTune to profile the code, my options are: 1) to profile the non-optimized code; 2) analyse the results using the assembly view?

- Mark as New
- Bookmark
- Subscribe
- Mute
- Subscribe to RSS Feed
- Permalink
- Report Inappropriate Content
Did you consider setting -inline-debug-info or options like -no-ip or -fno-inline-functions?
- Mark as New
- Bookmark
- Subscribe
- Mute
- Subscribe to RSS Feed
- Permalink
- Report Inappropriate Content
Actually I'm using GCC. What does the flag "-no-ip" disable?
- Mark as New
- Bookmark
- Subscribe
- Mute
- Subscribe to RSS Feed
- Permalink
- Report Inappropriate Content
Hi,
I'm sorry to come back to this question again, but today I saw a some strange results again.
This time I'm using intel compiler (version 13.1.3) with these flags: "-O3 -debug inline-debug-info -no-ip -fno-inline-functions" and VTune is reporting that a call instruction in the source is being responsible for ~140s of the program execution (tot. execution time is ~350s)... this seems a little odd. Can you guys tell me what I'm doing wrong?
I've attached a screenshot of the result window.
- Mark as New
- Bookmark
- Subscribe
- Mute
- Subscribe to RSS Feed
- Permalink
- Report Inappropriate Content
gcc doesn't share the debug-info options of icc, but -fno-inline-functions (icc linux) was taken directly from gcc. -Qip- is the ICL windows equivalent to disable in-lining.
- Mark as New
- Bookmark
- Subscribe
- Mute
- Subscribe to RSS Feed
- Permalink
- Report Inappropriate Content
Thanks for clarifying that. I've changed my experiments to use ICC.



- Mark as New
- Bookmark
- Subscribe
- Mute
- Subscribe to RSS Feed
- Permalink
- Report Inappropriate Content
Usually when building a benchmark do it without the optimization.The simplest example is looped N times call to library sin() function with the argument being constant value.In such a case optimizing compliler can evaluate at compile time the library call and calculate the value ahead of runtime thus eliminating the need to even execute that loop N times.

- Subscribe to RSS Feed
- Mark Topic as New
- Mark Topic as Read
- Float this Topic for Current User
- Bookmark
- Subscribe
- Printer Friendly Page