- Mark as New
- Bookmark
- Subscribe
- Mute
- Subscribe to RSS Feed
- Permalink
- Report Inappropriate Content
Hi,
I am writing a code with large arrays. The code works fine for small matrices but when I go beyond a certain level, the following error pops out:
Unhandled exception at 0x77913560 in 3d.exe: 0xC0000005: Access violation writing location 0x0000000000050e14.
I am dynamically allocating memory with variables, then deallocating them. The code is very long, longer than 20,000 lines. I want to trace the problem. Before deciding to start this topic, I search the forum and other sources. The "Stack Size" problem has seemed reasonable. I changed reserve size to 200,000,000 and commit size 20,000,000. The problem stayed the same with small differences:
Unhandled exception at 0x77913560 in 3d.exe: 0xC0000005: Access violation writing location 0x00000000001e0e84.
As you can see the code given at the end of the error line is different, I want to know and trace the error. Any kind of help will be appreciated. Thanks !
Emre
Link Copied
- Mark as New
- Bookmark
- Subscribe
- Mute
- Subscribe to RSS Feed
- Permalink
- Report Inappropriate Content
- Mark as New
- Bookmark
- Subscribe
- Mute
- Subscribe to RSS Feed
- Permalink
- Report Inappropriate Content
Thanks for the quick answer Sergey. I changed heap arrays to 1024. Now, I'm running the code....The problem does not change, but the place of it:
Unhandled exception at 0x000007fef5e3fe67 in 3d.exe: 0xC0000005: Access violation writing location 0x0000000000120ff8.
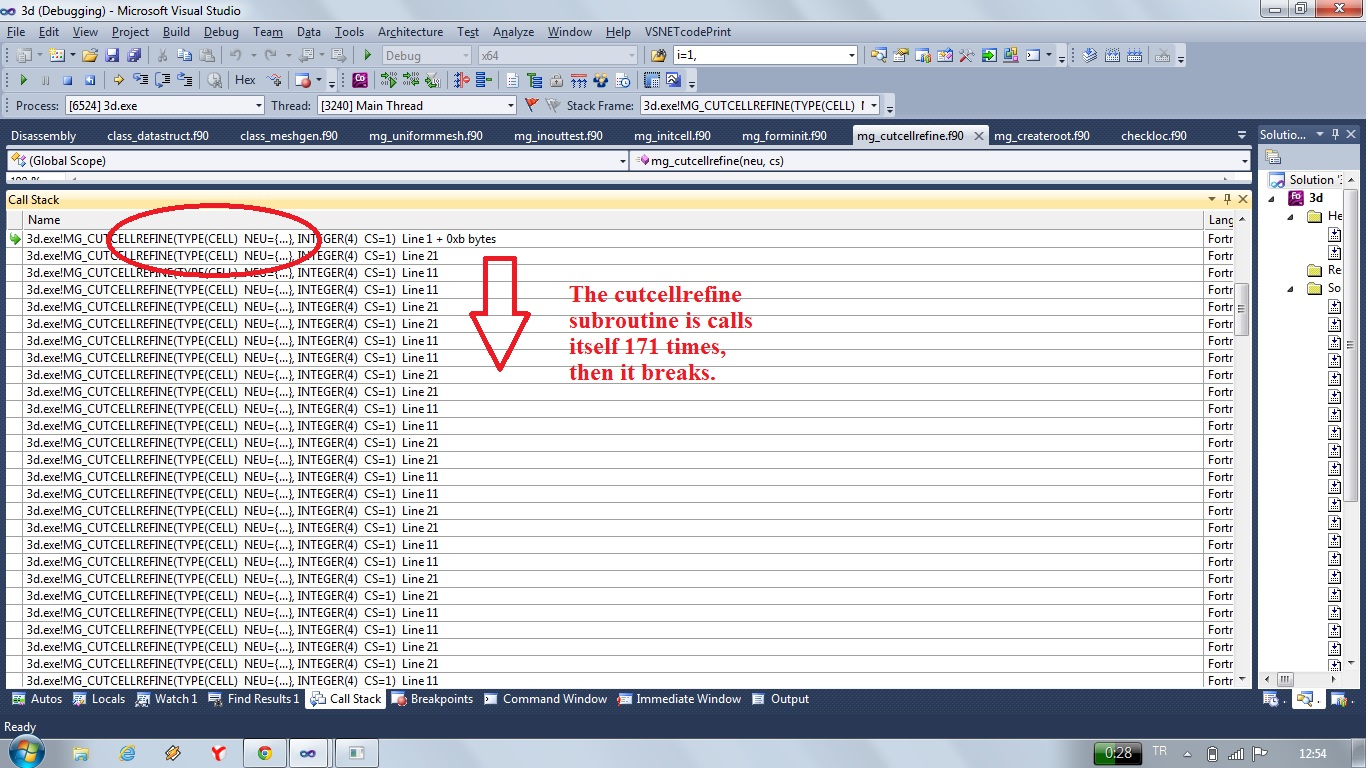
Physical Memory is 4GB and the virtual memory is set to min and max value of 2048 and 6000 MB . The maximum array size is 7 to 5 but the recursive subroutines and the pointers increase them. To make it clear: An 4x3 array with one-level high 1D array (which is pointed by 4x3 array) inside a recursive subroutine which calls 172 times itself and in the 173rd call the code breaks. The array elements are float, in Fortran literature real*8.
- Mark as New
- Bookmark
- Subscribe
- Mute
- Subscribe to RSS Feed
- Permalink
- Report Inappropriate Content
- Mark as New
- Bookmark
- Subscribe
- Mute
- Subscribe to RSS Feed
- Permalink
- Report Inappropriate Content
- Mark as New
- Bookmark
- Subscribe
- Mute
- Subscribe to RSS Feed
- Permalink
- Report Inappropriate Content
My guess is you are writing to an uninitialized (garbage) reference or writing beyond or before an array. The location written to was 0x0000000000120ff8 which is deffinately not on your x64 stack. 0120ff8 == 1183736. Add code to assert anything about to be referenced is not below 1183744. (your code will have been in error well before this, but this should be a good assert condition)
recursive subrouting FOO(A)
real :: A(4,3)
CALL CHECKLOC(LOC(A))
...
CALL CHECKLOC(LOC(A(I,J))
X =A(I,J)
...
SUBROUTINE CHECKLOC(L)
INTEGER(8) :: L
IF(L .le. 1183744) THEN
WRITE(*,*) "BUG - PLACE BREAK HERE"
ENDIF
END SUBROUTING CHECKLOC
jIm Dempsey
- Mark as New
- Bookmark
- Subscribe
- Mute
- Subscribe to RSS Feed
- Permalink
- Report Inappropriate Content
Hi Jim,
I apply your suggestion in my code, but it is hard to find the problem. When I insert the "call FOO" statements in my code, the program gives the same error with another location:
Unhandled exception at 0x000007feff7ffaad in 3d.exe: 0xC0000005: Access violation writing location 0x00000000000a0fe8.
Actually, I give the 4x3 array as an example. I do not know the "exact" problematic array. There are 20+ different arrays in my code.
- Mark as New
- Bookmark
- Subscribe
- Mute
- Subscribe to RSS Feed
- Permalink
- Report Inappropriate Content
@ Sergey,
I use min 11GB max 22GB but the error stays the same. By the way, when I remove a "one line self-calling(recursive)" do-loop inside the problematic subroutine, the error disappears but ,as expected, my code gives wrong outputs.
- Mark as New
- Bookmark
- Subscribe
- Mute
- Subscribe to RSS Feed
- Permalink
- Report Inappropriate Content
Access violation is not usually related to size of memory used. If you run the program under the debugger, it should stop at the point of the error (sometimes you may need to look at earlier stack frames to see your code rather than library code). If you enable traceback, it will tell you where the error occurred. I suggest using Intel Inspector XE's memory analysis to see if it identifies allocatable memory usage errors.
- Mark as New
- Bookmark
- Subscribe
- Mute
- Subscribe to RSS Feed
- Permalink
- Report Inappropriate Content
Steve Lionel (Intel) wrote:
Access violation is not usually related to size of memory used. If you run the program under the debugger, it should stop at the point of the error (sometimes you may need to look at earlier stack frames to see your code rather than library code). If you enable traceback, it will tell you where the error occurred. I suggest using Intel Inspector XE's memory analysis to see if it identifies allocatable memory usage errors.
Yes, I increase the virtual memory even more ( 21GB-42GB) but the stopping point is the same, (the error point) is the starting line of one of my recursive subroutine.
I don't know how to enable traceback, would you tell me how?...I did not hear before the functionality of Intel Inspector in this type of problems. I will try that. Thanks Steve !
- Mark as New
- Bookmark
- Subscribe
- Mute
- Subscribe to RSS Feed
- Permalink
- Report Inappropriate Content
You enable traceback by adding /traceback on the command line. It is the default when building a debug configuration.
- Mark as New
- Bookmark
- Subscribe
- Mute
- Subscribe to RSS Feed
- Permalink
- Report Inappropriate Content
- Mark as New
- Bookmark
- Subscribe
- Mute
- Subscribe to RSS Feed
- Permalink
- Report Inappropriate Content
- Mark as New
- Bookmark
- Subscribe
- Mute
- Subscribe to RSS Feed
- Permalink
- Report Inappropriate Content
Sergey Kostrov wrote:
>>...I increase the virtual memory even more ( 21GB-42GB) but the stopping point is the same, (the error point) is
>>the starting line of one of my recursive subroutine...Could you provide some details on what the code does in the recursive subroutine?
The recursive subroutine is a 300 line subroutine which is constructed for a 3 dimensional grid generator, works as a cut-cell refiner. It calls itself at 8 different parts of it and also some of them are in a do loop. It also calls 10 different subroutines.
- Mark as New
- Bookmark
- Subscribe
- Mute
- Subscribe to RSS Feed
- Permalink
- Report Inappropriate Content
iliyapolak wrote:
>>>Unhandled exception at 0x000007fef5e3fe67 in 3d.exe: 0xC0000005: Access violation writing location 0x0000000000120ff8.>>>
This exception can be due to some wrong pointer passed in registers or some garbage loaded in register and dereferenced by the code.
!address 0x00000000000120ff8 should reveal the what is the memory content in this address.
I guess so, the thing is I cannot find the wrong pointer.Can you tell me or show me how can I change this adresses into location to find this uninitialized (garbage) reference ? ( as jim dempsey said before 0120ff8 == 1183736. but when I change the virtual memory limits, it changes too. Thanks.
- Mark as New
- Bookmark
- Subscribe
- Mute
- Subscribe to RSS Feed
- Permalink
- Report Inappropriate Content
Steve Lionel (Intel) wrote:
You enable traceback by adding /traceback on the command line. It is the default when building a debug configuration.
Ok, Steve. /traceback is in the command line by default. I will try Inspector on Monday, then I will share the results.
- Mark as New
- Bookmark
- Subscribe
- Mute
- Subscribe to RSS Feed
- Permalink
- Report Inappropriate Content
- Mark as New
- Bookmark
- Subscribe
- Mute
- Subscribe to RSS Feed
- Permalink
- Report Inappropriate Content
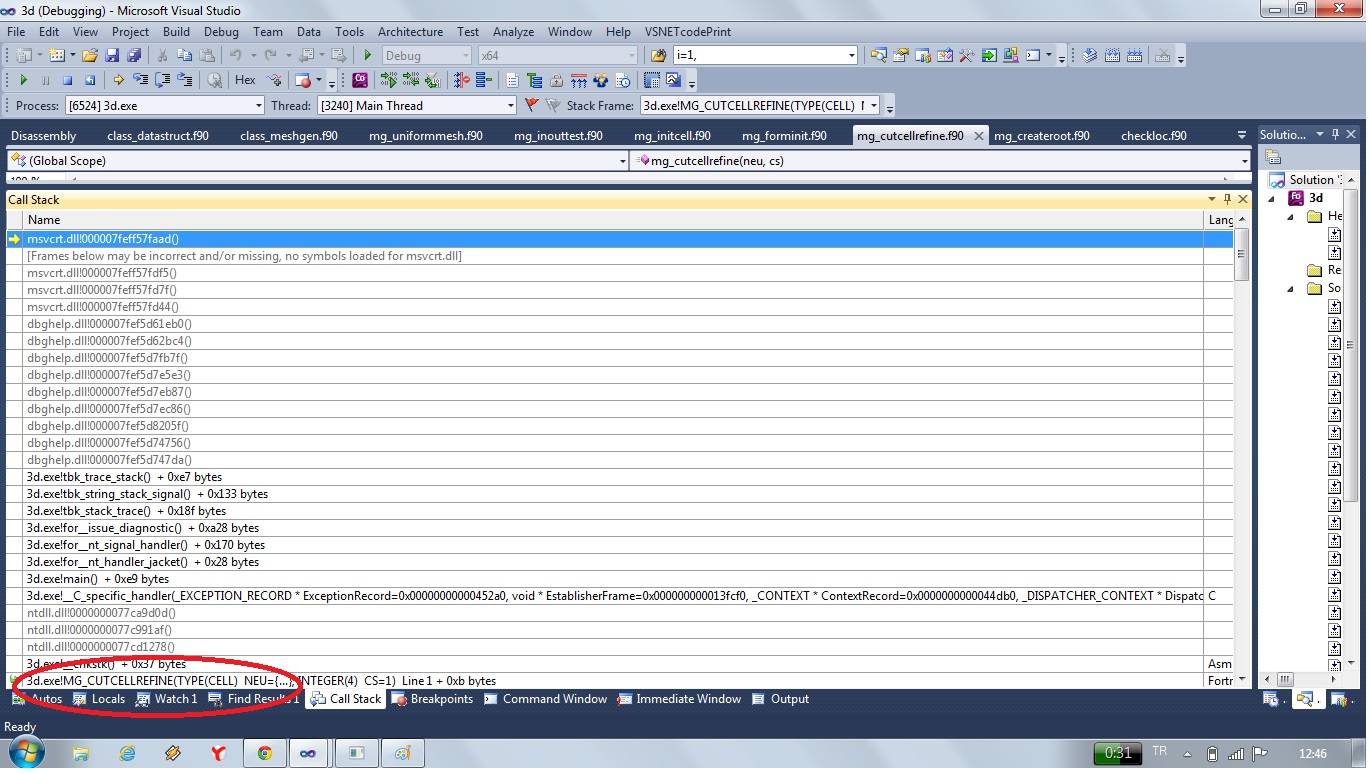
I forgot it. When I stop the debugger after this access violation error, the debug output gives:
'3d.exe': Loaded 'E:\3d\x64\Debug\3d.exe', Symbols loaded.
'3d.exe': Loaded 'C:\Windows\System32\ntdll.dll', Cannot find or open the PDB file
'3d.exe': Loaded 'C:\Windows\System32\kernel32.dll', Cannot find or open the PDB file
'3d.exe': Loaded 'C:\Windows\System32\KernelBase.dll', Cannot find or open the PDB file
'3d.exe': Loaded 'C:\Windows\System32\imagehlp.dll', Cannot find or open the PDB file
'3d.exe': Loaded 'C:\Windows\System32\msvcrt.dll', Cannot find or open the PDB file
'3d.exe': Loaded 'C:\Windows\System32\advapi32.dll', Cannot find or open the PDB file
'3d.exe': Loaded 'C:\Windows\System32\sechost.dll', Cannot find or open the PDB file
'3d.exe': Loaded 'C:\Windows\System32\rpcrt4.dll', Cannot find or open the PDB file
First-chance exception at 0x0000000140617977 in 3d.exe: 0xC00000FD: Stack overflow.
'3d.exe': Loaded 'C:\Windows\System32\dbghelp.dll', Cannot find or open the PDB file
First-chance exception at 0x000007feff57faad in 3d.exe: 0xC0000005: Access violation writing location 0x0000000000040fa8.
Unhandled exception at 0x000007feff57faad in 3d.exe: 0xC0000005: Access violation writing location 0x0000000000040fa8.
First-chance exception at 0x000007feff57faad in 3d.exe: 0xC0000005: Access violation writing location 0x0000000000040fa8.
Unhandled exception at 0x000007feff57faad in 3d.exe: 0xC0000005: Access violation writing location 0x0000000000040fa8.
The program '[6524] 3d.exe: Native' has exited with code -1073741819 (0xc0000005).
- Mark as New
- Bookmark
- Subscribe
- Mute
- Subscribe to RSS Feed
- Permalink
- Report Inappropriate Content
>>First-chance exception at 0x0000000140617977 in 3d.exe: 0xC00000FD: Stack overflow.
- Mark as New
- Bookmark
- Subscribe
- Mute
- Subscribe to RSS Feed
- Permalink
- Report Inappropriate Content
jimdempseyatthecove wrote:
>>First-chance exception at 0x0000000140617977 in 3d.exe: 0xC00000FD: Stack overflow.
I found a thread which is very similar to mine:
- Mark as New
- Bookmark
- Subscribe
- Mute
- Subscribe to RSS Feed
- Permalink
- Report Inappropriate Content
- Subscribe to RSS Feed
- Mark Topic as New
- Mark Topic as Read
- Float this Topic for Current User
- Bookmark
- Subscribe
- Printer Friendly Page