- Mark as New
- Bookmark
- Subscribe
- Mute
- Subscribe to RSS Feed
- Permalink
- Report Inappropriate Content
Dear All,
This a similar question to the one posted in https://software.intel.com/en-us/forums/topic/539492. In my case I have a mixed application .NET + Fortran DLL using VS 2013 and Fortran Composer 2015 Update 2.
There are few things not working properly in the debugger. These are related to the following code:
    pure subroutine ReaRateFT(PG, TG, yG, dp, icat, ReaRRx, ReaDHr)

        != K, =Pa, [ReaRRx] = mol/s m3S, [ReaDHr]=J/mol

        real(8), intent(in)     :: PG
        real(8), intent(in)     :: TG
        real(8), intent(in)     :: yG(IIc_FT)
        real(8), intent(in)     :: dp
        integer(2), intent(in)  :: icat
        real(8), intent(inout)  :: ReaRRx(1:IIr_FT, 0:2)
        real(8), intent(inout)  :: ReaDHr(1:IIr_FT)

        ! Local variables
        integer                 :: iWGS         ! WaterGasShift index
        integer                 :: iHYD         ! Hydrogenation index
        real(8)                 :: Pbar         ! Pressure [bar]
        real(8)                 :: kEq          ! Equilibrium constant
        real(8)                 :: kWGS1, kWGS2 !
        real(8)                 :: kHYD1, kHYD2 !
        real(8)                 :: den, tmp
        real(8)                 :: dummy(2,2)

        ! WaterGasShift and hydrogenation indices
        iWGS = 1
        iHYD = 2
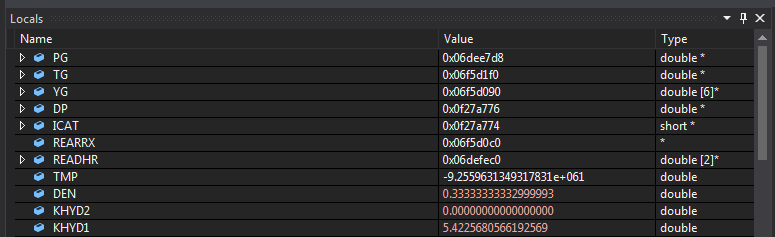
1) The local variables displayed are the followings (see attached Capture1.png). Note that there are a lot of variables missing. Also there are slots with a tiny symbol and no description or value. Furthermore the value field displays the pointer address instead of the actual value of the variable (as it did in VS 2010).
2) Now if the dummy(2,2) variable declaration is removed the list of local variables is more complete (see attached Capture2.png)
... but still with the value field contains pointer address -like information. More importantly I do not have access to ReaRRx which is a 2 dimensional array.
3) If I try to watch a global variable (module_name%%varname or module_name::varname) it is not displayed.
To compile the code I have:
* Enable native code debugging (in the .net application)
* Enable "Use Managed Compativility Mode" in Tools / Options / Debugging . Otherwise I was not able to start the many program.
Also after reading the Intel site, I have also re-install the Microsoft Visual C++ 2010 x86 redistributable. Still no luck! :-(
Thank you in advance for your help. Javier Goicochea
Link Copied
- Mark as New
- Bookmark
- Subscribe
- Mute
- Subscribe to RSS Feed
- Permalink
- Report Inappropriate Content
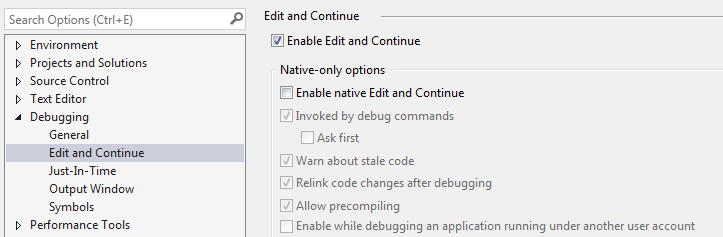
It is clear from your screenshots that the Fortran debug support is not loading. Make sure that in Tools > Options > Debugging > Edit and Continue that "Enable native edit and continue" is NOT checked.
- Mark as New
- Bookmark
- Subscribe
- Mute
- Subscribe to RSS Feed
- Permalink
- Report Inappropriate Content
Dear Steve,
Thank you for your prompt reply. After having the "Enable native edit and continue" NOT checked, all problems mentioned still persist. The screens captured below were taken after changing the mentioned option and VS was restarted and the project rebuilt.
Thank you Javier
- Mark as New
- Bookmark
- Subscribe
- Mute
- Subscribe to RSS Feed
- Permalink
- Report Inappropriate Content
Dear Steve,
I have restarted the computer and reinstalled the update 2 (w_fcompxe_online_2015.2.179.exe). Still the problems are present.
Kindly advise what to do next!
Thank you, Javier
- Mark as New
- Bookmark
- Subscribe
- Mute
- Subscribe to RSS Feed
- Permalink
- Report Inappropriate Content
I think it's your turning on "Use Managed Compatibility Mode" that is the problem - this disables use of the Fortran debugging support. I've never needed this on when running or debugging C++.NET projects.
- Mark as New
- Bookmark
- Subscribe
- Mute
- Subscribe to RSS Feed
- Permalink
- Report Inappropriate Content
Steve,
When I turn the Managed Compatibility Mode option OFF the program freezes. Basically, it starts loading several DLLs but then nothing else happens and the main window never opens. If I stop the program with the red button nothing happens. I have to use the Task manager to stop it.
In the meantime I went back to VS2010 and there everything works fine.
Javier
- Mark as New
- Bookmark
- Subscribe
- Mute
- Subscribe to RSS Feed
- Permalink
- Report Inappropriate Content
This is not under our control, sorry. When you turn that option on, it blocks our debug support from loading. I don't know why your program would freeze without it, as it should only affect debugging, but that is a Microsoft issue.
- Mark as New
- Bookmark
- Subscribe
- Mute
- Subscribe to RSS Feed
- Permalink
- Report Inappropriate Content
Dear Steve,
Thank you for your help. The problem is now solved.
I tried two things: The first one was to update VS 2013 with the Update 4. Unfortunately, this did not solve the problem. The second was to update the Intel Parallel Studio XE 2015 to Update 3 (today 12.05.2015), and this in fact solved the problem! :-)
Now I am able to see local and global variables in Debug or Release. In my opinion, the Fortran debugger was not starting or falling to start. BTW I did not change any compiler option in the meantime.
Best, Javier
- Mark as New
- Bookmark
- Subscribe
- Mute
- Subscribe to RSS Feed
- Permalink
- Report Inappropriate Content
Glad to hear it.
- Subscribe to RSS Feed
- Mark Topic as New
- Mark Topic as Read
- Float this Topic for Current User
- Bookmark
- Subscribe
- Printer Friendly Page