- Mark as New
- Bookmark
- Subscribe
- Mute
- Subscribe to RSS Feed
- Permalink
- Report Inappropriate Content
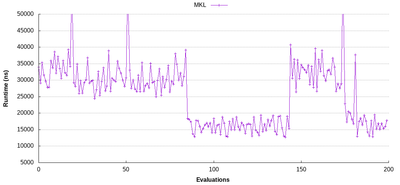
I am benchmarking the Intel MKL sgemm routine for input size M=10, N=500, K=64 on a dual-socket system with 2 Intel Xeon Gold 6140 CPUs and have noticed that sometimes the runtimes of a few consecutive sgemm calls is significantly lower than the calls before. I made sure that no other programs are executed while benchmarking. I have plotted the runtimes of 200 evaluations and you can see the drop around the 90th evaluation and again around the 180th:
Can you help me identify, what causes the sudden drop in runtime in the plot? This behavior makes it difficult for me to compare MKL's sgemm with other implementations, because I can never be sure if such a drop has happened or not.
Many thanks in advance!
Link Copied
- Mark as New
- Bookmark
- Subscribe
- Mute
- Subscribe to RSS Feed
- Permalink
- Report Inappropriate Content
Hi,
Could you please provide the source code which you are using for benchmarking? Are you using FORTRAN / C?
Also, could you please provide the following details which will help us to investigate better:
System configuration(OS Version),
Memory configuration(RAM, Cache),
BLAS Version,
Compiler Version.
Thanks are Regards
Goutham
- Mark as New
- Bookmark
- Subscribe
- Mute
- Subscribe to RSS Feed
- Permalink
- Report Inappropriate Content
Hi Goutham,
many thanks for your reply. I am using the following C++ code for benchmarking:
#include <mkl.h>
#include <iostream>
#include <algorithm>
#include <vector>
#include <chrono>

int main(int argc, const char **argv) {
    // input size
    const int M = 10;
    const int N = 500;
    const int K = 64;

    // initialize data
    auto a = (float*) mkl_malloc(M * K * sizeof(float), 64); for (int i = 0; i < M * K; ++i) a[i] = (i + 1) % 10;
    auto b = (float*) mkl_malloc(K * N * sizeof(float), 64); for (int i = 0; i < K * N; ++i) b[i] = (i + 1) % 10;
    auto c = (float*) mkl_malloc(M * N * sizeof(float), 64); for (int i = 0; i < M * N; ++i) c[i] = 0;

    // warm ups
    for (int i = 0; i < 10; ++i) {
        cblas_sgemm(CblasRowMajor, CblasNoTrans, CblasNoTrans,
                    M, N, K,
                    1.0f,
                    a, K,
                    b, N,
                    0.0f,
                    c, N);
    }

    // evaluations
    std::vector<long long> evaluations;
    for (int i = 0; i < 2000; ++i) {
        auto start = std::chrono::high_resolution_clock::now();
        cblas_sgemm(CblasRowMajor, CblasNoTrans, CblasNoTrans,
                    M, N, K,
                    1.0f,
                    a, K,
                    b, N,
                    0.0f,
                    c, N);
        auto end = std::chrono::high_resolution_clock::now();
        evaluations.push_back(std::chrono::duration_cast<std::chrono::nanoseconds>(end - start).count());
    }
    std::cout << "min runtime: " << *std::min_element(evaluations.begin(), evaluations.end()) << "ns" << std::endl;

    mkl_free(a);
    mkl_free(b);
    mkl_free(c);
}
This is my system:
- OS: CentOS Linux release 7.8.2003
- RAM: 192GB
- Compiler: icpc (ICC) 19.0.1.144 20181018
- BLAS: MKL 2020 Initial Release
Best,
Richard
- Mark as New
- Bookmark
- Subscribe
- Mute
- Subscribe to RSS Feed
- Permalink
- Report Inappropriate Content
Hi Richard,
Thanks for providing the source code and system environment details.
We tried to reproduce the same on our end with slightly different hardware on Ubuntu 18.04 OS but with same compiler version and MKL version. We didn't see any such sudden drops and spikes on our end.
However, we are escalating this thread to Subject Matter Experts who will guide you further.
Have a Good day!
Thanks & Regards
Goutham
- Mark as New
- Bookmark
- Subscribe
- Mute
- Subscribe to RSS Feed
- Permalink
- Report Inappropriate Content
if you will run this code once again, will you see the same picture?
- Mark as New
- Bookmark
- Subscribe
- Mute
- Subscribe to RSS Feed
- Permalink
- Report Inappropriate Content
Hi Gennady,
sorry for the delay. Yes, the result is still the same.
Best,
Richard
- Mark as New
- Bookmark
- Subscribe
- Mute
- Subscribe to RSS Feed
- Permalink
- Report Inappropriate Content
Could you try to set the KMP Affinity masks as follows:
export KMP_AFFINITY=compact,1,0,granularity=fine
usually using this affinity help to get the best performance on systems with multi-core processors by requiring that threads do not migrate from core to core. To do this, bind threads to the CPU cores by setting an affinity mask to threads.
- Mark as New
- Bookmark
- Subscribe
- Mute
- Subscribe to RSS Feed
- Permalink
- Report Inappropriate Content
Many thanks for still trying to solve this problem!
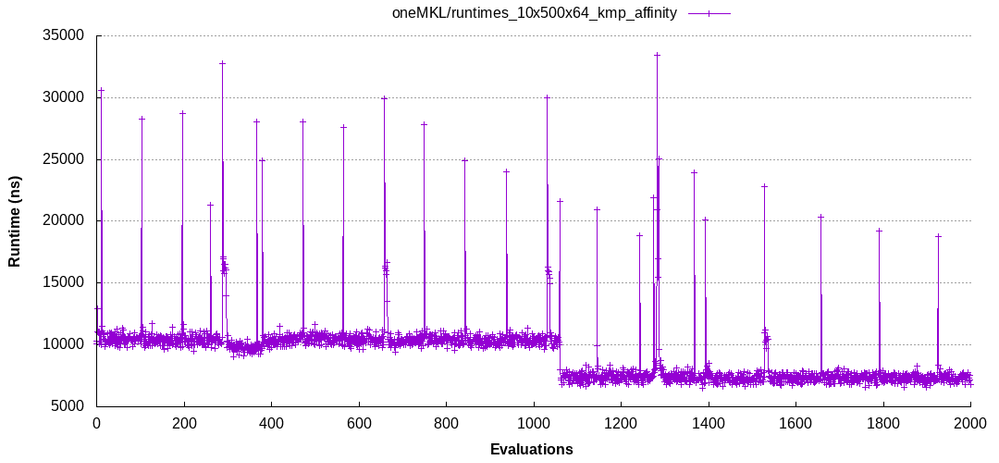
I tried setting the affinity mask and it does indeed seem to improve the measurement:
It is pretty stable now for the first 200 evaluations as measured above, but I noticed it still drops off a bit at the end. Do you maybe have any insights what could be the cause of this?
- Mark as New
- Bookmark
- Subscribe
- Mute
- Subscribe to RSS Feed
- Permalink
- Report Inappropriate Content
I think it's OS's fluctuations.
- Mark as New
- Bookmark
- Subscribe
- Mute
- Subscribe to RSS Feed
- Permalink
- Report Inappropriate Content
The issue is closing and we will no longer respond to this thread. If you require additional assistance from Intel, please start a new thread. Any further interaction in this thread will be considered community only.
- Subscribe to RSS Feed
- Mark Topic as New
- Mark Topic as Read
- Float this Topic for Current User
- Bookmark
- Subscribe
- Printer Friendly Page

