- Mark as New
- Bookmark
- Subscribe
- Mute
- Subscribe to RSS Feed
- Permalink
- Report Inappropriate Content
Hello.
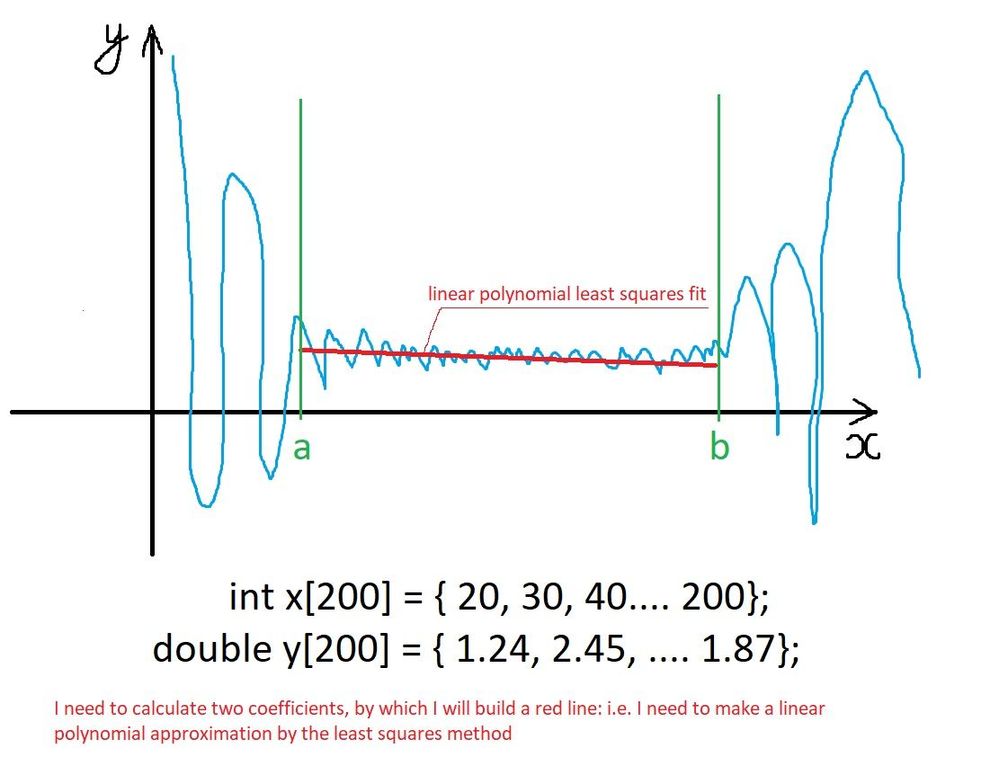
I have a function f = y (x).
On the interval [a, b] I need to do a linear polynomial approximation of the data.
Linear means that the polynomial is of the first degree.
This means that it is described by two coefficients.
Those. I need to find two coefficients by which I can draw a red line like in the picture.
What MKL library functions can I do this?
- Mark as New
- Bookmark
- Subscribe
- Mute
- Subscribe to RSS Feed
- Permalink
- Report Inappropriate Content
Link Copied
- Mark as New
- Bookmark
- Subscribe
- Mute
- Subscribe to RSS Feed
- Permalink
- Report Inappropriate Content
You asked more or less the same question a month ago:
and the question was answered in that thread. In short, use the Lapack routine ?GELS.
- Mark as New
- Bookmark
- Subscribe
- Mute
- Subscribe to RSS Feed
- Permalink
- Report Inappropriate Content
Yes you are right. The problem is I can't figure out how to use the Lapack routine ?GELS.
I have my x[200] and y[200] data.
How do I use my data in LAPACKE_dgels()?
info = LAPACKE_dgels(APACK_ROW_MAJOR,'N',m,n,nrhs,*a,lda,*b,ldb);And where will the result be? Where will the two coefficients be?
- Mark as New
- Bookmark
- Subscribe
- Mute
- Subscribe to RSS Feed
- Permalink
- Report Inappropriate Content
- Mark as New
- Bookmark
- Subscribe
- Mute
- Subscribe to RSS Feed
- Permalink
- Report Inappropriate Content
Hi,
Glad to know that your issue is resolved. If you need any additional information, please submit a new question as this thread will no longer be monitored.
Thanks!
- Subscribe to RSS Feed
- Mark Topic as New
- Mark Topic as Read
- Float this Topic for Current User
- Bookmark
- Subscribe
- Printer Friendly Page
