- Mark as New
- Bookmark
- Subscribe
- Mute
- Subscribe to RSS Feed
- Permalink
- Report Inappropriate Content
↵
Link Copied
- Mark as New
- Bookmark
- Subscribe
- Mute
- Subscribe to RSS Feed
- Permalink
- Report Inappropriate Content
may be a bug!
- Mark as New
- Bookmark
- Subscribe
- Mute
- Subscribe to RSS Feed
- Permalink
- Report Inappropriate Content
- Mark as New
- Bookmark
- Subscribe
- Mute
- Subscribe to RSS Feed
- Permalink
- Report Inappropriate Content
- Make sure that you have only 1 instance of Visual Studio open.
I've never had more than one instance open.
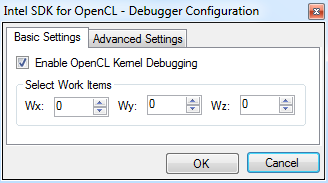
- Check that OpenCL debugger is enabled in the "Tools->Intel SDK for OpenCL - Debugger" dialog.
I have done so. I provided this attachment to demonstrate this.
- Check the work-items value in the same dialog with respect to kernel execution. This is important in case the kernel runs with some offset and with the default work-items value (0,0,0) the debugger will not stop at the kernel breakpoint.
I am not using offsets. I am using only one, very simple work-item. I am using (0,0,0) as the selected work-item.
- Make sure that you are working with Intel OpenCL platform and you select CPU device.
My code prints the name of the device used: Device selected: Intel(R) Core(TM) i7-3770 CPU @ 3.40GHz.
- Add necessary build parameters to clBuildProgram like so: clBuildProgram(g_program, 0, NULL, "-g -s c:\\work\\ToneMapping\\ToneMapping.cl", NULL, NULL);
Again, my attachments show that yes, I am doing this.
- Make sure that the kernel source file you open in Visual Studio is the same file/text you pass to clCreateProgramWithSource function.
I'm sure. kernels_root\normalise.cl is the kernel file. I'm quite confident that my debugging flags are correctly formed.
- Put a breakpoint at host code right before (or at) clCreateContext function call. Put another breakpoint at kernel function code. Make sure that you put the breakpoint at the same kernel function that will be called/enqueued later.
- Run the debugging session (F5). The debugger stops near clCreateContext. At this point the kernel breakpoint should be shown as not active (The breakpoint will not currently be hit...).
- Step over the clCreateContext function call. At this point the kernel breakpoint should become active, showing something like "At ToneMapping.cl, line 60 in process 'icldbgsrv.exe'".
- Continue debugging (F5) - kernel breakpoint should be hit.
It does not become active after clCreateContext. Attachment to this post shows this.
- In case the kernel debugger still doesn't work with your project could you please try to debug one of the sample projects (Tone Mapping for example).
I will try this and post the results later.
Don't know if it helps, but I have VS2013 installed as well (though I am not using it (it lacks Boost support currently)).
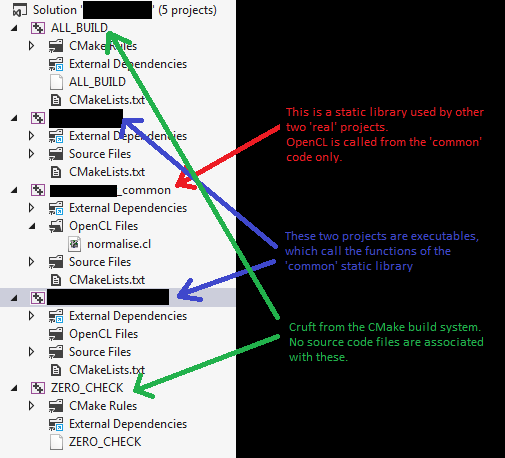
As I mentioned before, the OpenCL code is not in the project which executes, but in a (non-executable) 'common' project (in the same Visual Studio solution) which is accessed by the project being debugged.
- Mark as New
- Bookmark
- Subscribe
- Mute
- Subscribe to RSS Feed
- Permalink
- Report Inappropriate Content
Oops, forgot to answer your first question.
- Which version of the SDK you are using?
The installer file I used is named intel_sdk_for_ocl_applications_2013_r2_x64_setup.exe
My Kernel Builder says it is version 3.0.0.1.
- Mark as New
- Bookmark
- Subscribe
- Mute
- Subscribe to RSS Feed
- Permalink
- Report Inappropriate Content
I downloaded the Tone Mapping sample.
Breakpoints don't work there, either. (The program seems to run fine other than that.)
As the program starts up, it prints out the selected OpenCL device: it selected the Intel CPU (rather than my nVidia graphics card).
I modified the project to include Intel's debug flags, and converted to an Intel OpenCL project, and checked that Intel OpenCL debugging was enabled. (I am assuming that the project doesn't use offsets, i.e. that work-item (0,0,0) will exist.)
Annotated screenshots attached.
- Mark as New
- Bookmark
- Subscribe
- Mute
- Subscribe to RSS Feed
- Permalink
- Report Inappropriate Content
- Mark as New
- Bookmark
- Subscribe
- Mute
- Subscribe to RSS Feed
- Permalink
- Report Inappropriate Content
Thanks - that was indeed the issue.
I uninstalled the (old-version) SDK, and downloaded and installed intel_sdk_for_ocl_applications_2014_x64_setup.msi . OpenCL debugging is now working correctly.
(Kernel Builder now reports version as 1.2.0.117.)
A warning about the incompatible packages would have been nice, though.
Also, in Visual Studio, going to Help > About Visual Studio shows "OpenCL Debug Engine" as being version 1. It showed this value before I moved to the new version, too.
- Subscribe to RSS Feed
- Mark Topic as New
- Mark Topic as Read
- Float this Topic for Current User
- Bookmark
- Subscribe
- Printer Friendly Page