- Mark as New
- Bookmark
- Subscribe
- Mute
- Subscribe to RSS Feed
- Permalink
- Report Inappropriate Content
Please upgrade to 3522 to resolve this issue.
---- original post ----
We are investigating this issue but are having trouble reproducing the problem. In the meantime the following workarounds have helped some users:
-
Close the Emulate tab's "debug console" (the CDT instance that you open with the "bug" icon) before switching away from the Emulate tab to a new tab. Then, when you return to the Emulate tab, restart (reopen) the CDT or debug console by push the "bug" icon.
-
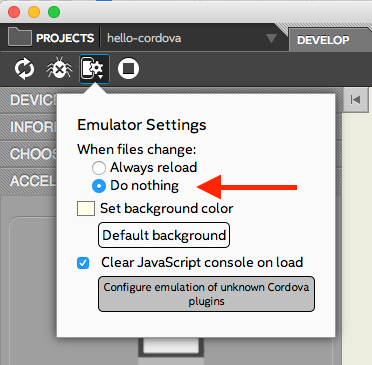
Disable the "auto-refresh" feature of the Emulate tab (see image below):
-
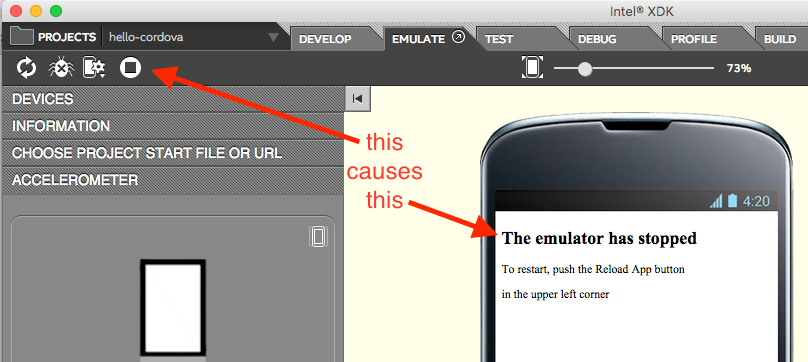
Use the "Stop" button in the Emulate tab's toolbar to stop the Emulator when you switch to another tab (for efficiency, use an external editor to work on your code, for example Brackets or Sublime, so you can keep the Emulate tab open and running until you need to use the Debug or Build tab):
-
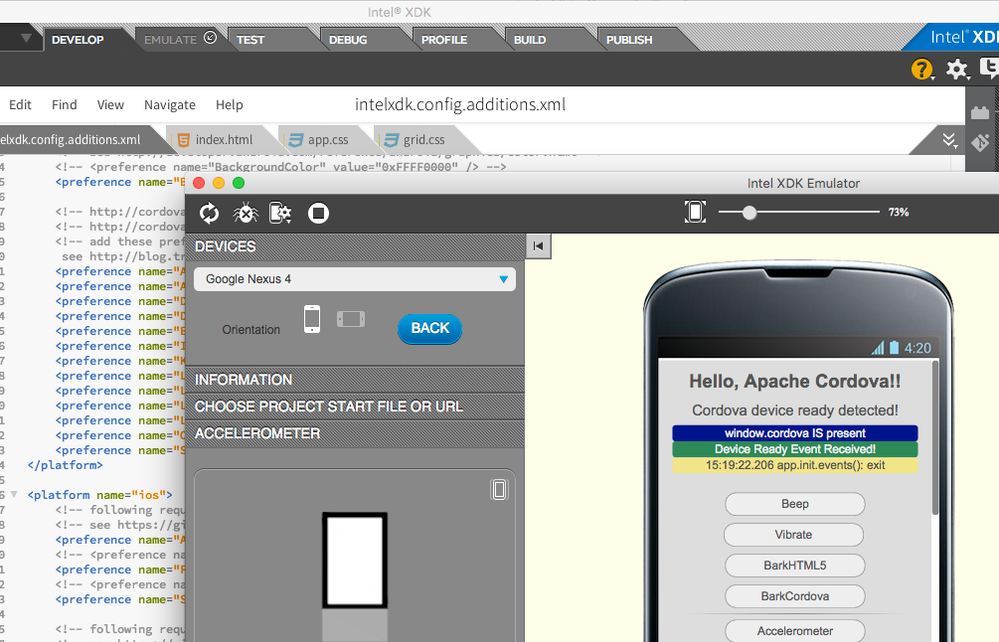
Use the Emulate tab in "detached mode." You do this by clicking the small arrow in the Emulate tab that is pointing in the "northeast direction" (see image above). Doing this will result in a floating Emulate tab window, like that shown below (note the arrow in the Emulate tab now points in the "southwest direction"):
-
Use the Debug tab as an alternative. If you switch to the Develop tab and make changes and then switch back to the Debug tab it will prompt you to reload the changed files in your project. That feature is not as obvious as the Emulate tab, but it has the same effect. It also provides a much higher-fidelity debug environment. See this page for how to use the Debug tab > https://software.intel.com/en-us/xdk/docs/using-the-debug-tab < and this video > https://software.intel.com/en-us/xdk/videos/debug-tab-html5-apps-debugging-using-the-intel-xdk < Note that you can also use an external editor while you use the Debug tab.
The Debug tab will allow you to reload and restart the app when you make changes to your files. If you are not prompted by the Debug tab to reload changes to your sources you can force a reload by clicking the "bug" icon in the Debug toolbar while you are debugging with the Debug tab. Clicking that "bug" icon while debugging will force a reload of your app's sources.
- Tags:
- HTML5
- Intel® XDK
Link Copied
- Mark as New
- Bookmark
- Subscribe
- Mute
- Subscribe to RSS Feed
- Permalink
- Report Inappropriate Content
I use IntelXDK both on my Windows and Mac. Earlier I used to get this issue on Windows and now I am getting this on Mac. Whenever I want to debug and launch debugger the app freezes for some time (nearly 1 minute) and then it starts working. If I don't open debugger window then this issue will not come. The freezing time will increase on opening debugger window multiple times. Once I restart XDK again the freeze time gets reduced and after 4 to 5 times of use of debugger window the freeze time will increase. I guess I have given some more information for your debugging. Thanks a lot.
- Mark as New
- Bookmark
- Subscribe
- Mute
- Subscribe to RSS Feed
- Permalink
- Report Inappropriate Content
Thank you, Gopal, for the additional information. Please give the Debug tab a try as an alternative.
- Mark as New
- Bookmark
- Subscribe
- Mute
- Subscribe to RSS Feed
- Permalink
- Report Inappropriate Content
The best solution is to use the Profile tab and debug the app on a real device.
- Mark as New
- Bookmark
- Subscribe
- Mute
- Subscribe to RSS Feed
- Permalink
- Report Inappropriate Content
Still get many-many times crash.
How to add memory hip on Intel XDK Java process ?
Thanks,
- Mark as New
- Bookmark
- Subscribe
- Mute
- Subscribe to RSS Feed
- Permalink
- Report Inappropriate Content
Muhammad,
This should not happen with the latest XDK version. Which version are you using?
Pamela
- Subscribe to RSS Feed
- Mark Topic as New
- Mark Topic as Read
- Float this Topic for Current User
- Bookmark
- Subscribe
- Printer Friendly Page


