- Mark as New
- Bookmark
- Subscribe
- Mute
- Subscribe to RSS Feed
- Permalink
- Report Inappropriate Content
Dear all,
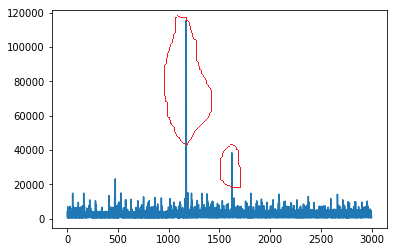
I am trying to record the MEM_LOAD_UOPS_MISC_RETIRED.LLC_MISS using pcm-core (windows). But the data I record seems unusual as attached.
I tried several processor tests from phoronix. But I always get extremely large value during the test.
The command I used to record the counter value is
pcm-core 0.001 -csv=test.csv -e cpu/umask=0x02,event=0xD4,name=MEM_LOAD_UOPS_MISC_RETIRED.LLC_MISS/
I set the time interval as 1 ms to record the event.
As shown in the test.png, there are two or three time points which have unusual large value. Most data of these time series is around 2000~4000. But the abnormal value is nearly 120000. I am not sure if it is correct or not. There is no other significant program running as it could be noise or a reason to the unusual value. So anybody knows what's the reason of that unusual value?
Best regards,
- Mark as New
- Bookmark
- Subscribe
- Mute
- Subscribe to RSS Feed
- Permalink
- Report Inappropriate Content
The value is plausible -- 120000 cache lines in 1 millisecond corresponds to 7.68 GB/s, which is achievable by a single core.
But it is still a suspiciously high number. I would add another performance counter event to measure how much kernel activity is taking place in each interval. Either cycles or instructions are reasonable, but cycles are perhaps easier to understand.
Event 0xD4 is only used for MEM_LOAD_UOPS_RETIRED.LLC_MISS on second-generation Intel Core processors and the Intel Xeon E3-1200 processors.
The Cycles Not Halted event is "architectural", so it should apply to most Intel processors. I don't know how to set some of these bits by name in pmc-core, but the raw encodings would be 0x0043003c for CPU_CLK_UNHALTED.THREAD_P and 0x0042003c for the same measure, but limited to kernel-mode activities. The kernel-mode cycles would have to be a large fraction (1/2 or more?) of the total cpu cycles in an interval with high LLC misses for a single kernel thread to generate miss counts this large in 1 millisecond.
Link Copied
- Mark as New
- Bookmark
- Subscribe
- Mute
- Subscribe to RSS Feed
- Permalink
- Report Inappropriate Content
The value is plausible -- 120000 cache lines in 1 millisecond corresponds to 7.68 GB/s, which is achievable by a single core.
But it is still a suspiciously high number. I would add another performance counter event to measure how much kernel activity is taking place in each interval. Either cycles or instructions are reasonable, but cycles are perhaps easier to understand.
Event 0xD4 is only used for MEM_LOAD_UOPS_RETIRED.LLC_MISS on second-generation Intel Core processors and the Intel Xeon E3-1200 processors.
The Cycles Not Halted event is "architectural", so it should apply to most Intel processors. I don't know how to set some of these bits by name in pmc-core, but the raw encodings would be 0x0043003c for CPU_CLK_UNHALTED.THREAD_P and 0x0042003c for the same measure, but limited to kernel-mode activities. The kernel-mode cycles would have to be a large fraction (1/2 or more?) of the total cpu cycles in an interval with high LLC misses for a single kernel thread to generate miss counts this large in 1 millisecond.
- Mark as New
- Bookmark
- Subscribe
- Mute
- Subscribe to RSS Feed
- Permalink
- Report Inappropriate Content
Thank you very much Dr. Bandwidth! I just figured out why the unusual value happened. As I set 1 ms as time interval of recording, but the actually recording time interval varies around 1 ms - 3 ms. For the unusual time point, the time interval is 30 ms and that's why it produce extremely large data. It records the data in 30 ms.
Here is a previous post I asked "if we could record data in a 1 ms resolution", it appears that 1 ms resolution is too small for our cpu, but I don't know why sometimes it records such a large time interval (30 ms).
https://software.intel.com/en-us/comment/1942571#comment-1942571
McCalpin, John (Blackbelt) wrote:The value is plausible -- 120000 cache lines in 1 millisecond corresponds to 7.68 GB/s, which is achievable by a single core.
But it is still a suspiciously high number. I would add another performance counter event to measure how much kernel activity is taking place in each interval. Either cycles or instructions are reasonable, but cycles are perhaps easier to understand.
Event 0xD4 is only used for MEM_LOAD_UOPS_RETIRED.LLC_MISS on second-generation Intel Core processors and the Intel Xeon E3-1200 processors.
The Cycles Not Halted event is "architectural", so it should apply to most Intel processors. I don't know how to set some of these bits by name in pmc-core, but the raw encodings would be 0x0043003c for CPU_CLK_UNHALTED.THREAD_P and 0x0042003c for the same measure, but limited to kernel-mode activities. The kernel-mode cycles would have to be a large fraction (1/2 or more?) of the total cpu cycles in an interval with high LLC misses for a single kernel thread to generate miss counts this large in 1 millisecond.
- Subscribe to RSS Feed
- Mark Topic as New
- Mark Topic as Read
- Float this Topic for Current User
- Bookmark
- Subscribe
- Printer Friendly Page