- Mark as New
- Bookmark
- Subscribe
- Mute
- Subscribe to RSS Feed
- Permalink
- Report Inappropriate Content
Hi
I want to run vTune(CUI) using vTune(GUI) settings.Is the contents of Configure Analysis of vTune(GUI) saved in a file?
Thanks
- Mark as New
- Bookmark
- Subscribe
- Mute
- Subscribe to RSS Feed
- Permalink
- Report Inappropriate Content
Hi,
Good day to you.
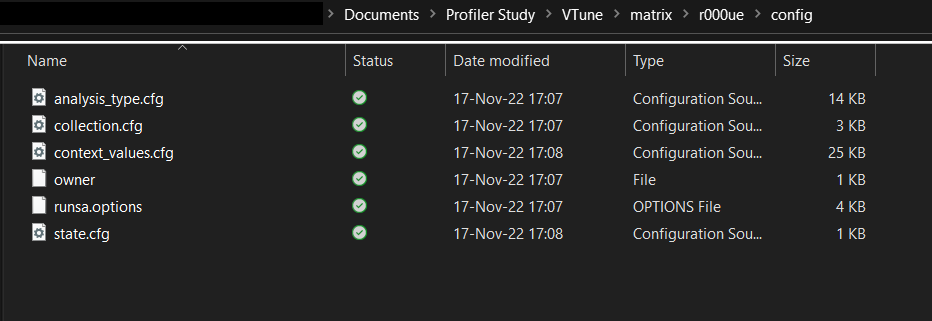
The settings for any analysis whether it be pre-defined, or custom is present inside the result directory where the collection results were saved. (If you hover over the result folder created inside Intel VTune Profiler (GUI)'s left pane or right click on it, you can view/copy the result directory as shown in screenshot). There is a sub-directory called config inside the result directory. This contains a file with the name context_values.cfg which lists out all the configuration values of the analysis in XML format. (Refer screenshot)
Hope this helps. If this resolves your issue, make sure to accept this as a solution. This would help others with similar issues.
Thanks and Regards,
Jyothis V James
Link Copied
- Mark as New
- Bookmark
- Subscribe
- Mute
- Subscribe to RSS Feed
- Permalink
- Report Inappropriate Content
Hi,
Good day to you.
Thanks for posting in Intel Communities.
If you want to run vTune(CUI) using vTune(GUI) settings. You can follow the below step:
1. Configure the analysis with which you want to profile your application.
2. Click on the command line option (Highlighted in the screenshot below)

3. You will get the command line code for your analysis type (check the below screenshot)

4. You can run Vtune CLI using those commands
If this resolves your issue, make sure to accept this as a solution. This would help others with similar issues.
Thank You!
- Mark as New
- Bookmark
- Subscribe
- Mute
- Subscribe to RSS Feed
- Permalink
- Report Inappropriate Content
Hi,VaradJ-san
Thank you for your reply.
>3. You will get the command line code for your analysis type (check the below screenshot)
I understand what the command line is. For example, the following command line is displayed when performing custom analysis.
In which file are the settings (uarch-exploration-0) saved?
"C:\Program Files (x86)\Intel\oneAPI\vtune\latest\bin64\vtune" -collect uarch-exploration-0 --app-working-dir=/root/intel/vtune/samples/matrix -- /root/intel/vtune/samples/matrix/matrix
Thank You.
- Mark as New
- Bookmark
- Subscribe
- Mute
- Subscribe to RSS Feed
- Permalink
- Report Inappropriate Content
Hi,
Good day to you.
The settings for any analysis whether it be pre-defined, or custom is present inside the result directory where the collection results were saved. (If you hover over the result folder created inside Intel VTune Profiler (GUI)'s left pane or right click on it, you can view/copy the result directory as shown in screenshot). There is a sub-directory called config inside the result directory. This contains a file with the name context_values.cfg which lists out all the configuration values of the analysis in XML format. (Refer screenshot)
Hope this helps. If this resolves your issue, make sure to accept this as a solution. This would help others with similar issues.
Thanks and Regards,
Jyothis V James
- Mark as New
- Bookmark
- Subscribe
- Mute
- Subscribe to RSS Feed
- Permalink
- Report Inappropriate Content
Hi,
Thanks for accepting the solution.
Since your queries are resolved, we will no longer respond to this thread. If you require additional assistance from Intel, please start a new thread. Any further interaction in this thread will be considered community only.
Regards,
Jyothis V James
- Subscribe to RSS Feed
- Mark Topic as New
- Mark Topic as Read
- Float this Topic for Current User
- Bookmark
- Subscribe
- Printer Friendly Page