- Mark as New
- Bookmark
- Subscribe
- Mute
- Subscribe to RSS Feed
- Permalink
- Report Inappropriate Content

Link Copied
- Mark as New
- Bookmark
- Subscribe
- Mute
- Subscribe to RSS Feed
- Permalink
- Report Inappropriate Content
It seemed that everythingwas OK before entering source view.
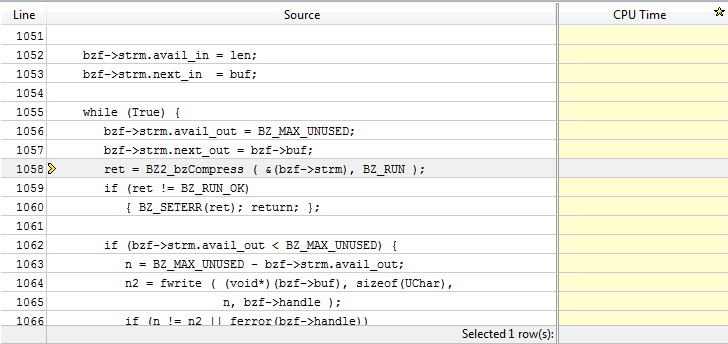
Is "fallbackSort" a hot function? When you went to source view of this, it should jump to highest CPU time of source line. Note that BZ2_bzCompress may consume CPU time, but its CPU time is not counted inthe line of caller unless BZ2_bzCompress is "inlined" function. You may find BZ2_bzCompress in bottom-up report, thengo source view of this, to display source line with CPU time of BZ2_bzCompress.
Please feel free to attach result directory, if you have other question (run Hotspots Analysis shortly toreduce size of result).
Regards, Peter
- Mark as New
- Bookmark
- Subscribe
- Mute
- Subscribe to RSS Feed
- Permalink
- Report Inappropriate Content
I have to include more compiler options?
- Mark as New
- Bookmark
- Subscribe
- Mute
- Subscribe to RSS Feed
- Permalink
- Report Inappropriate Content
- Mark as New
- Bookmark
- Subscribe
- Mute
- Subscribe to RSS Feed
- Permalink
- Report Inappropriate Content
Your .7z file doesn't include .amplxe file - need this to open result, also need other contents under result directory.
- Mark as New
- Bookmark
- Subscribe
- Mute
- Subscribe to RSS Feed
- Permalink
- Report Inappropriate Content
- Mark as New
- Bookmark
- Subscribe
- Mute
- Subscribe to RSS Feed
- Permalink
- Report Inappropriate Content
- Mark as New
- Bookmark
- Subscribe
- Mute
- Subscribe to RSS Feed
- Permalink
- Report Inappropriate Content
studio 2010. I don't know if I can send the source code. The config
for building the binary is "windows-em64t-icl". The compiler
options are:
##############################
# Compiler section
##############################
CC = cl /Z7 /DEBUG
CXX = cl /Z7 /DEBUG
FC = ifort
OBJ = .obj
int=default:
EXTRA_LDFLAGS = /F512000000
fp=default:
EXTRA_LDFLAGS = /F950000000
...401.bzip2...=default:
PORTABILITY = -D_Complex= -DSPEC_CPU_P64
##############################
# Baseline Tuning Flags
# default baseline for int and fp 2006
##############################
default=default=default=
OPTIMIZE= -fast
CXXOPTIMIZE= -Qcxx_features
sw_base_ptrsize = 64-bit
sw_peak_ptrsize = Not Applicable
default=peak=default=default:
OPTIMIZE= -fast -Qauto_ilp32
sw_peak_ptrsize = 32/64-bit
PASS1_CFLAGS= -Qprof_gen
PASS2_CFLAGS= -Qprof_use
PASS1_CXXFLAGS= -Qprof_gen
PASS2_CXXFLAGS= -Qprof_use
PASS1_FFLAGS= -Qprof_gen
PASS2_FFLAGS= -Qprof_use
PASS1_LDFLAGS= -Qprof_gen
PASS2_LDFLAGS= -Qprof_use
for compiling and building the codes we used this command in windows command prompt:
2- should be build in release mode (optimized) or debug mode? Which oneis correct?
Please let me know if there is a way to help identify the problem.
- Mark as New
- Bookmark
- Subscribe
- Mute
- Subscribe to RSS Feed
- Permalink
- Report Inappropriate Content

- Mark as New
- Bookmark
- Subscribe
- Mute
- Subscribe to RSS Feed
- Permalink
- Report Inappropriate Content
I don't know whether using /Z7 in place of the usual /Zi will affect this.
- Mark as New
- Bookmark
- Subscribe
- Mute
- Subscribe to RSS Feed
- Permalink
- Report Inappropriate Content
Thanks Tim.
Here is tip to display inlined functions when using Intel C++ compiler with -O2, -O3, or -ipo optimization switches. Read this article
2013 beta has fixed the issue, can't display call stack info Bottom-up report, in 2011 version.
- Mark as New
- Bookmark
- Subscribe
- Mute
- Subscribe to RSS Feed
- Permalink
- Report Inappropriate Content
You should find some interesting comments on the relative functionality of /Zi and /Z7 for CL by firing up your search engine.
- Mark as New
- Bookmark
- Subscribe
- Mute
- Subscribe to RSS Feed
- Permalink
- Report Inappropriate Content
- Mark as New
- Bookmark
- Subscribe
- Mute
- Subscribe to RSS Feed
- Permalink
- Report Inappropriate Content
1. If BZ2_bzCompress was inlined, all CPU time should be counted in the caller.
2. If BZ2_bzCompress was not inlined, all CPU time was count itself, please go source view of BZ2_bzCompress.
Regards, Peter
- Mark as New
- Bookmark
- Subscribe
- Mute
- Subscribe to RSS Feed
- Permalink
- Report Inappropriate Content
according to your suggestion, to use /Z7 compiler option, we used this parameter in our config file. But for changing the inline functions,
we used the compiler option /Ob0 ( for MS visual studio ), which disables inline expansion. Now our config file for compiling the codes is something like this:
CC = cl /Z7 /Ob0 /DEBUG
is that true?
( before that, we just used /Z7 without /Ob0 )
If you generate binary in above way, should see hot lines in hot fuunctionBZ2_bzCompress().
In your old r011hs result, I saw hot function BZ2_decompress() - CPU time 0.559, but BZ2_beCompress() was not shown. Was it possible there is limited work for compression work? <10ms?
- Mark as New
- Bookmark
- Subscribe
- Mute
- Subscribe to RSS Feed
- Permalink
- Report Inappropriate Content

- Mark as New
- Bookmark
- Subscribe
- Mute
- Subscribe to RSS Feed
- Permalink
- Report Inappropriate Content
- Subscribe to RSS Feed
- Mark Topic as New
- Mark Topic as Read
- Float this Topic for Current User
- Bookmark
- Subscribe
- Printer Friendly Page