- Mark as New
- Bookmark
- Subscribe
- Mute
- Subscribe to RSS Feed
- Permalink
- Report Inappropriate Content
Hi,
I am analyzing the different between two designs which process millions of messages. One design uses polymorphism and the other doesnt- each message will be represented by a polymorphic sub type.
I have profiled both designs using VTune. The High-level summary data seems to make sense- the polymorphic design has a higher "branch mispredict" rate, higher CPI and higher "ICache misses" rate than the non-polymorphic version implemented with IF statements.
The polymorphic design has a line of source code like this:
object->virtualFunction();
and this is called millions of times (where the sub type changes each time). I am expecting the polymorphic design to be slower because of branch target mispredictions/instruction misses. As said above, the VTune "summary" tab seems to confirm this. However, when I go to the metrics next to the line of source code there are absolutely no metrics except for:
- Filled pipeline slots total -> Retiring -> General retirement
- Filled pipeline slots self -> Retiring -> General retirement
- Unfilled pipeline slots total -> Front end bound -> Front end bandwidth -> Front end bandwidth MITE
- Unfilled pipeline slots self -> Front end bound -> Front end bandwidth -> Front end bandwidth MITE
None of the branch prediction columns have data, nor do the instruction cache miss columns??
Could somebody please comment on whether this seems sensible? To me it doesn't- how can there be no branch misprediction or instruction cache miss statistics for a line of polymorphic code where the branch target will constantly be changing per message?
Link Copied
- Mark as New
- Bookmark
- Subscribe
- Mute
- Subscribe to RSS Feed
- Permalink
- Report Inappropriate Content
When you enabled optimization switches, some functions which are called significantly will be compiled with "inlined" - so branch instructions are reduced. You have two options to verify:
1. Disable optimization switches when compiling.
2. For using Intel C/C++ Composer 13.1 above, use "CFLAGS=-O2 -g -inline-debug-info" like to build, and turn on "inline enabled" in VTune report
If you see branch misprediction metric data in Summary tab, what are contributed in source line? See bottom-up report to know metric in function/source line.
Regards, Peter
- Mark as New
- Bookmark
- Subscribe
- Mute
- Subscribe to RSS Feed
- Permalink
- Report Inappropriate Content
Hi Peter, thanks for replying.
The compiler wouldn't be able to inline the polymorphic function call because it wouldn't know the exact subtype of the object (preventing inlining is another cost to Polymorphism). The exact code for the virtual method can only be known at run-time via the vptr and the vtable, surely?
- Mark as New
- Bookmark
- Subscribe
- Mute
- Subscribe to RSS Feed
- Permalink
- Report Inappropriate Content
Hm, it could be issue if the method entry address got via vptr in the table, at runtime. VTune cannot know what exact function is before running (based on debug info), I think. -Peter
- Mark as New
- Bookmark
- Subscribe
- Mute
- Subscribe to RSS Feed
- Permalink
- Report Inappropriate Content
Ok but the line of code:
object->virtualFunction();
is translated in to ASM. This ASM will then have an instruction address. When the CPU attempts to execute this unconditional branch it will try to predict the target branch address. If the address is right/wrong surely VTune should still be able to say for line object->virtualFunction() the CPU correctly/incorrectly guessed the branch target X%?
I'd be ever so surprised if VTune cannot profile polymorphic method calls/unconditional branches!?
- Mark as New
- Bookmark
- Subscribe
- Mute
- Subscribe to RSS Feed
- Permalink
- Report Inappropriate Content
Is it possible that you can provide me a simple test case of polymorphic method? I may try to construct new one, there is limited time today...
- Mark as New
- Bookmark
- Subscribe
- Mute
- Subscribe to RSS Feed
- Permalink
- Report Inappropriate Content
Here you go:
#include <iostream>

class Parent{
public:
	    virtual void f() = 0;
};

class Child1 : public Parent{
public:
	    virtual void f(){
		        std::cout << "Child1" << std::endl;
	    }
};

class Child2 : public Parent{
public:
	    virtual void f(){
        		std::cout << "Child2" << std::endl;
	    }
};


int main(){

	    Parent* p;

	    for(int i=0; i<100000; i++){
        		if(__rdtsc() % 2 == 0){
           			 p = new Child1();
		        }
        		else{
			            p = new Child2();
		        }
		        p->f();
    	}
}
- Mark as New
- Bookmark
- Subscribe
- Mute
- Subscribe to RSS Feed
- Permalink
- Report Inappropriate Content
>>>Ok but the line of code:
object->virtualFunction();
is translated in to ASM. This ASM will then have an instruction address>>>
Usually object is pointed by *this pointer(in Windows it is stored in ecx register) which points to vtbl table.If I am correct new operator implementation returns pointer to the newly heap allocated object.VTBL table stores function pointers to class member functions.
- Mark as New
- Bookmark
- Subscribe
- Mute
- Subscribe to RSS Feed
- Permalink
- Report Inappropriate Content
iliyapolak wrote:
>>>Ok but the line of code:
object->virtualFunction();
is translated in to ASM. This ASM will then have an instruction address>>>
Usually object is pointed by *this pointer(in Windows it is stored in ecx register) which points to vtbl table.If I am correct new operator implementation returns pointer to the newly heap allocated object.VTBL table stores function pointers to class member functions.
Yes- I don't disagree with you there (its kind of what I was saying earlier). So I was expecting vtune to keep track of the branch target mispredictions for the instruction address referring to object->virtualmethod() and show me in the profiler?
- Mark as New
- Bookmark
- Subscribe
- Mute
- Subscribe to RSS Feed
- Permalink
- Report Inappropriate Content
Compiler will not be able to know at compile time the the exact result of the branch instruction which involves rdtsc() intrinsic call and modulo operation.The proper type of virtual function being called will be resolved by RTTI.Compiler will probably create in every branch target by comparing remainder of modulo operation which is probably stored in edx register to zero and will insert conditional jump to vtbl tables with two vptr's.
It could be nice to see assembly code.
- Mark as New
- Bookmark
- Subscribe
- Mute
- Subscribe to RSS Feed
- Permalink
- Report Inappropriate Content
iliyapolak wrote:
Compiler will not be able to know at compile time the the exact result of the branch instruction which involves rdtsc() intrinsic call and modulo operation.The proper type of virtual function being called will be resolved by RTTI.Compiler will probably create in every branch target by comparing remainder of modulo operation which is probably stored in edx register to zero and will insert conditional jump to vtbl tables with two vptr's.
It could be nice to see assembly code.
I understand that object->virtualfunction() will resolve to ASM (obviously). Are you saying because its a polymorphic call, resolved at run-time VTune cannot measure the branch mispredictions? That doesnt make sense because VTune can handle normal conditional branch (IF statement) mispredictions at run-time, so why can't polymorphic branch target mispredictions be displayed?
All of the mispredictions are effectively at run-time because that is when the CPU tries to predict and gets it correct or mispredicts- so I'm unsure why polymorphic branch target predictions are out of VTune's capability?
- Mark as New
- Bookmark
- Subscribe
- Mute
- Subscribe to RSS Feed
- Permalink
- Report Inappropriate Content
>>>So I was expecting vtune to keep track of the branch target mispredictions for the instruction address referring to object->virtualmethod() and show me in the profiler>>>
It seems strange that VTune cannot display data related to branch misprediction.I am not sure if this is related to polymorphic code execution.VTune driver which runs in kernel mode has no knowledge of code polymorphism.In very simplistic description it is only "reading" the values of the branch predicted/mispredicted counter and it is tracking current instruction pointer in order to resolve the functions with the help of pdb files(this could be done by different module).
- Mark as New
- Bookmark
- Subscribe
- Mute
- Subscribe to RSS Feed
- Permalink
- Report Inappropriate Content
iliyapolak wrote:
>>>So I was expecting vtune to keep track of the branch target mispredictions for the instruction address referring to object->virtualmethod() and show me in the profiler>>>
It seems strange that VTune cannot display data related to branch misprediction.I am not sure if this is related to polymorphic code execution.VTune driver which runs in kernel mode has no knowledge of code polymorphism.In very simplistic description it is only "reading" the values of the branch predicted/mispredicted counter and it is tracking current instruction pointer in order to resolve the functions with the help of pdb files(this could be done by different module).
When I profiled the example code I posted above I couldnt see any branch misprediction metrics for
p->f();
Are you able to put my code in to your environment and see whether you can?
- Mark as New
- Bookmark
- Subscribe
- Mute
- Subscribe to RSS Feed
- Permalink
- Report Inappropriate Content
T C wrote:
Quote:
iliyapolak wrote:Compiler will not be able to know at compile time the the exact result of the branch instruction which involves rdtsc() intrinsic call and modulo operation.The proper type of virtual function being called will be resolved by RTTI.Compiler will probably create in every branch target by comparing remainder of modulo operation which is probably stored in edx register to zero and will insert conditional jump to vtbl tables with two vptr's.
It could be nice to see assembly code.
I understand that object->virtualfunction() will resolve to ASM (obviously). Are you saying because its a polymorphic call, resolved at run-time VTune cannot measure the branch mispredictions? That doesnt make sense because VTune can handle normal conditional branch (IF statement) mispredictions at run-time, so why can't polymorphic branch target mispredictions be displayed?
All of the mispredictions are effectively at run-time because that is when the CPU tries to predict and gets it correct or mispredicts- so I'm unsure why polymorphic branch target predictions are out of VTune's capability?
Hi
You probably misunderstood me.My previous post #10 was about possible implementation of main() function code at machine code level.
I am sure that VTune kernel driver which is accessing CPU branch prediction/misprediction counters can track such a type of branch as provided by your code.It is probably some higher level module of VTune which is responsible for parsing and analyzing the code being profiled.
- Mark as New
- Bookmark
- Subscribe
- Mute
- Subscribe to RSS Feed
- Permalink
- Report Inappropriate Content
<<<Are you able to put my code in to your environment and see whether you can?>>>
Yes I will test your code today and provide the result.
- Mark as New
- Bookmark
- Subscribe
- Mute
- Subscribe to RSS Feed
- Permalink
- Report Inappropriate Content
iliyapolak wrote:
Quote:
T C wrote:Quote:
iliyapolak wrote:
Compiler will not be able to know at compile time the the exact result of the branch instruction which involves rdtsc() intrinsic call and modulo operation.The proper type of virtual function being called will be resolved by RTTI.Compiler will probably create in every branch target by comparing remainder of modulo operation which is probably stored in edx register to zero and will insert conditional jump to vtbl tables with two vptr's.
It could be nice to see assembly code.
I understand that object->virtualfunction() will resolve to ASM (obviously). Are you saying because its a polymorphic call, resolved at run-time VTune cannot measure the branch mispredictions? That doesnt make sense because VTune can handle normal conditional branch (IF statement) mispredictions at run-time, so why can't polymorphic branch target mispredictions be displayed?
All of the mispredictions are effectively at run-time because that is when the CPU tries to predict and gets it correct or mispredicts- so I'm unsure why polymorphic branch target predictions are out of VTune's capability?
Hi
You probably misunderstood me.My previous post #10 was about possible implementation of main() function code at machine code level.
I am sure that VTune kernel driver which is accessing CPU branch prediction/misprediction counters can track such a type of branch as provided by your code.It is probably some higher level module of VTune which is responsible for parsing and analyzing the code being profiled.
I misunderstood :)
By looking at this question on branch target buffer predictions:
http://software.intel.com/en-us/forums/topic/392268
it looks like I should be seeing branch target misprediction metrics in the "branch mispredictions" column when you're in the source view for the line of the polymorphic function?
?
- Mark as New
- Bookmark
- Subscribe
- Mute
- Subscribe to RSS Feed
- Permalink
- Report Inappropriate Content
Lets wait for the response from Intel engineers.
- Mark as New
- Bookmark
- Subscribe
- Mute
- Subscribe to RSS Feed
- Permalink
- Report Inappropriate Content
Hi
I performed VTune general exploration analysis on your code and can confirm your results.That's mean no branch misprediction data was collected on polymorphic code.
- Mark as New
- Bookmark
- Subscribe
- Mute
- Subscribe to RSS Feed
- Permalink
- Report Inappropriate Content
Intel- please tell me there is a solution/fix to measuring branch target predictions for polymorphic methods?
- Mark as New
- Bookmark
- Subscribe
- Mute
- Subscribe to RSS Feed
- Permalink
- Report Inappropriate Content
@ T C
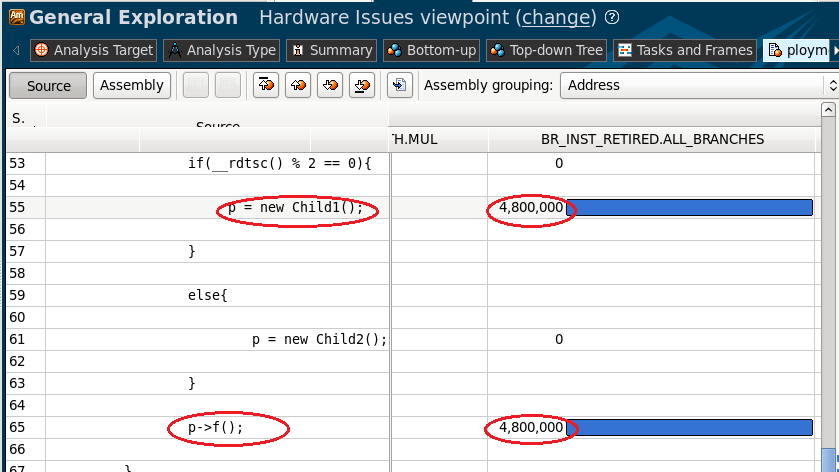
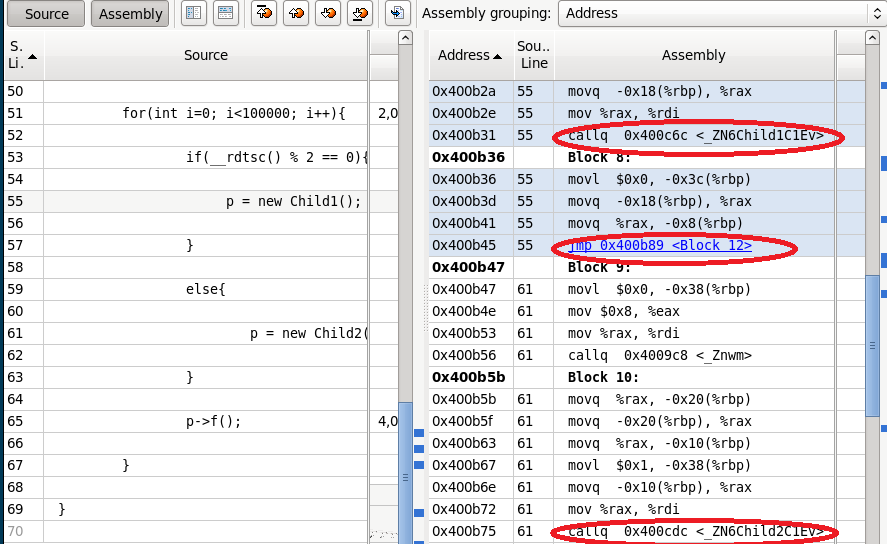
Thanks for your test case. However I cannot see any problem with "branch misprediction" metric in report:
I used Intel C/C++ Composer 13.0 SP1 to build - "icpc -g ploymorphic.cpp -o ploymorphic", then use general exploration analysis to profile.
In result, I can see misprediction metric in main() function which ran Child1-f() and f(). Please see attached screen-shots
Regards, Peter
- Mark as New
- Bookmark
- Subscribe
- Mute
- Subscribe to RSS Feed
- Permalink
- Report Inappropriate Content
- Subscribe to RSS Feed
- Mark Topic as New
- Mark Topic as Read
- Float this Topic for Current User
- Bookmark
- Subscribe
- Printer Friendly Page