- Mark as New
- Bookmark
- Subscribe
- Mute
- Subscribe to RSS Feed
- Permalink
- Report Inappropriate Content
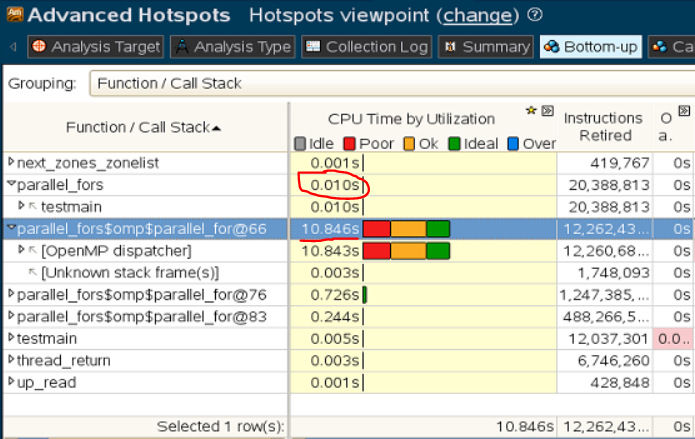
I was testing VTune Amplifier XE on some OpenMP code and got a profile like this:

I found it strange that the time spent in the OpenMP parallel-for loops was not attributed to the function containing them, i.e., parallel_fors(). Have others experienced this and what did you think?
Link Copied
- Mark as New
- Bookmark
- Subscribe
- Mute
- Subscribe to RSS Feed
- Permalink
- Report Inappropriate Content
intel openmp always had this treatment of making a separate function for each parallel region. this often seems convenient in accounting separately serial and parallel time. it was extra useful when there was an omp profile option.
- Mark as New
- Bookmark
- Subscribe
- Mute
- Subscribe to RSS Feed
- Permalink
- Report Inappropriate Content
parallel_for$omp$parallel_for@?? are functions in OMP library to complete the tasks, which were submitted by parallel_for in user's code. There is no caller-callee relationship, the reason is that parallel_for$omp$parallel_for@?? works in another thread, you should see same behavior when using Intel? Thread Building Block (TBB). Light CPU time is spent in user code, exact work is in parallel library.
- Subscribe to RSS Feed
- Mark Topic as New
- Mark Topic as Read
- Float this Topic for Current User
- Bookmark
- Subscribe
- Printer Friendly Page