- Mark as New
- Bookmark
- Subscribe
- Mute
- Subscribe to RSS Feed
- Permalink
- Report Inappropriate Content
Hi,
I recently discovered that Vtune Amplifier is able to do CPU profiling (https://software.intel.com/en-us/forums/intel-vtune-amplifier-xe/topic/569950) for Python. One has to simply export a variable (export AMPLXE_EXPERIMENTAL=python-hotspots).
My application is actually consisting of a mix of python and cython. Cython (http://docs.cython.org/) is a way to compile hotspots of your python to C code.
When I run the "Python Hotspot" mode in Vtune Amplifier, the cythonized parts of my code seem to be ignored in the analysis. When I choose the "Basic Hotspots" mode instead, it seems the python code is completely skipped, and only the C code remains as part of the analysis.
My aim is to have an analysis of the integral code, i.e. the combination of the python code, calling cython pieces, which in its turn call C-code.
Can this achieved with VTune Amplifier XE 2016 (Ubuntu 12.04)? Am I doing something wrong? Is there a way to retrieve CPU profiling diagnostics of the code in its entirety? Do you see any alternatives? Should I try to create a new "Analysis Type"?
regards,
Nick
Link Copied
- Mark as New
- Bookmark
- Subscribe
- Mute
- Subscribe to RSS Feed
- Permalink
- Report Inappropriate Content
Hi,
Thank you to use VTune(TM) Amplifier XE to analyze performance in Python/Cython code.
I can get expected performance data in hot function with a simple test case (I attached c1.pyx, p2.pyx). Was it possible that you ran short time or you didn't use "-g" to build C file(s)?
1. Environment:
[cpp]
# cython --version
Cython version 0.21.2
# python --version
Python 2.6.6
# amplxe-cl -version
Intel(R) VTune(TM) Amplifier XE 2016 Update 2 (build 444464) Command Line Tool
[/cpp]
2. Compile c1.pyx to generate shared object
[cpp]
# cython c1.pyx
# gcc -c -g -fPIC -I/usr/include/python2.6 c1.c
# gcc -shared c1.o -o c1.so [/cpp]
3. Use VTune Amplifier to collect data
[cpp]
# amplxe-cl -c advanced-hotspots -knob collection-detail=stack-sampling -- python p2.py [/cpp]
You will see expected data in VTune's report.

- Mark as New
- Bookmark
- Subscribe
- Mute
- Subscribe to RSS Feed
- Permalink
- Report Inappropriate Content
Hi,
Thank you very much for your help!
I've used your example below to illustrate what I exactly mean.
1. Environment:
 cython --version
Cython version 0.22
 python --version
Python 2.7.10
 amplxe-cl -version
Intel(R) VTune(TM) Amplifier XE 2016 Update 2 (build 444464) Command Line Tool
2. Code
I modified your code to illustrate my problem. In addition to your cythonized function, I have another pure-python function, named do_circle_py, called from within p2.py.
import os
import timeit
import math

def do_circle_py(longitude1,latitude1,longitude2,latitude2):

    radius = 3956 #miles
    pi = 3.14159265
    x = pi/180.0
    a,b,theta,c
    cnt = 0

    while (cnt<10):


        a = (90.0-latitude1)*(x)

        b = (90.0-latitude2)*(x)

        theta = (longitude2-longitude1)*(x)

        c = math.acos((math.cos(a)*math.cos(b)) +

                     (math.sin(a)*math.sin(b)*math.cos(theta)))
        cnt = cnt + 1

    return radius*c


longitude1, latitude1, longitude2, latitude2 = -72.345, 34.323, -61.823, 54.826

num = 500000

t_py = timeit.Timer("do_circle_py(%f,%f,%f,%f)" % (longitude1,latitude1,longitude2,latitude2))

t_cy = timeit.Timer("c1.do_circle(%f,%f,%f,%f)" % (longitude1,latitude1,longitude2,latitude2), "import c1")


print "Cython function do_circle()", t_cy.timeit(num), "sec"
print "Pure python function do_circle()", t_cy.timeit(num), "sec"
from the command line, you can see that both calls take up about the same time:
python p2.py
Cython function do_circle() 2.83643198013 sec
Pure python function do_circle() 2.82571315765 sec
3. My problem
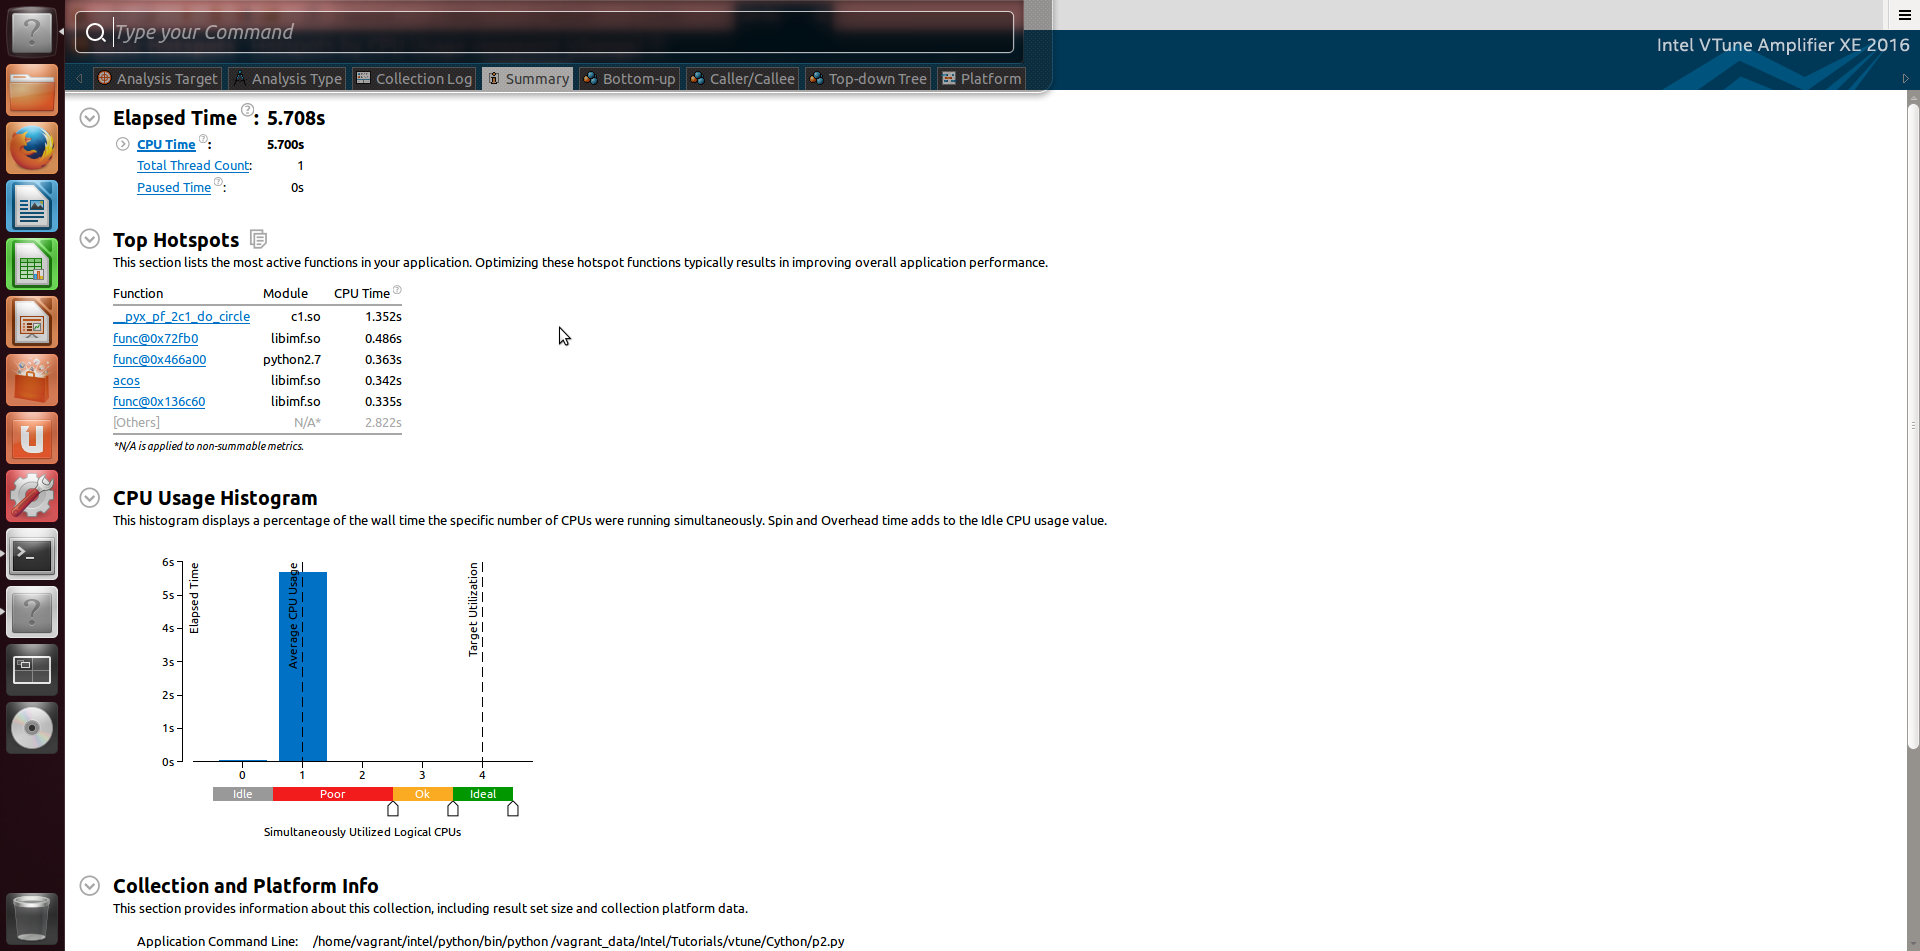
Using the Basic Hotspot analysis, I only see the cython function "do_circle" as the main hotspot. This is similar to what you showed. Moreover, as much as 2.8s of the 5.7s CPU time could not be pinpointed. To me that says the basic hotspot analysis tool is not able to sample the pure-python functions.
On the other hand, the Python hotspot analysis only shows the "timeit" function as the main hotspot, and ignores the cythonized function, or its pure python equivalent.
What I am looking for is a way that would combine both approaches, i.e. identifying hotspots in cython code as well as pure python functions.
- Mark as New
- Bookmark
- Subscribe
- Mute
- Subscribe to RSS Feed
- Permalink
- Report Inappropriate Content
Thank you to clarify this more clearly. I modified test code in p2.py which calls functions in Python & Cython, only hot function in Cython ("do_circle_cy()") can be detected, but "do_circle_py()" in Python was not displayed. That is true for both using basic hotspots and advanced hotspots.
I will report this to developer, and try to get back to you as soon as I can.
- Subscribe to RSS Feed
- Mark Topic as New
- Mark Topic as Read
- Float this Topic for Current User
- Bookmark
- Subscribe
- Printer Friendly Page