- Mark as New
- Bookmark
- Subscribe
- Mute
- Subscribe to RSS Feed
- Permalink
- Report Inappropriate Content
Hello!
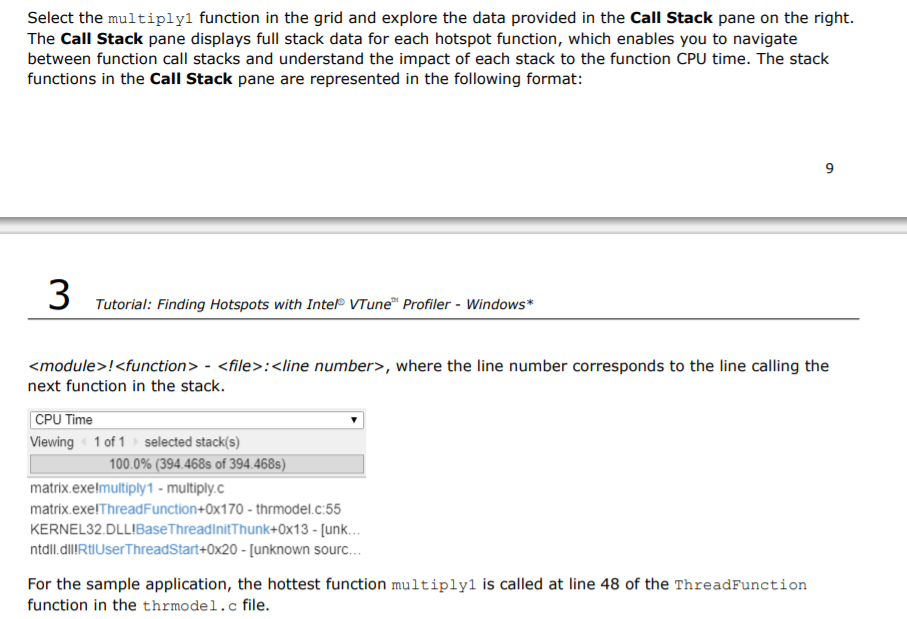
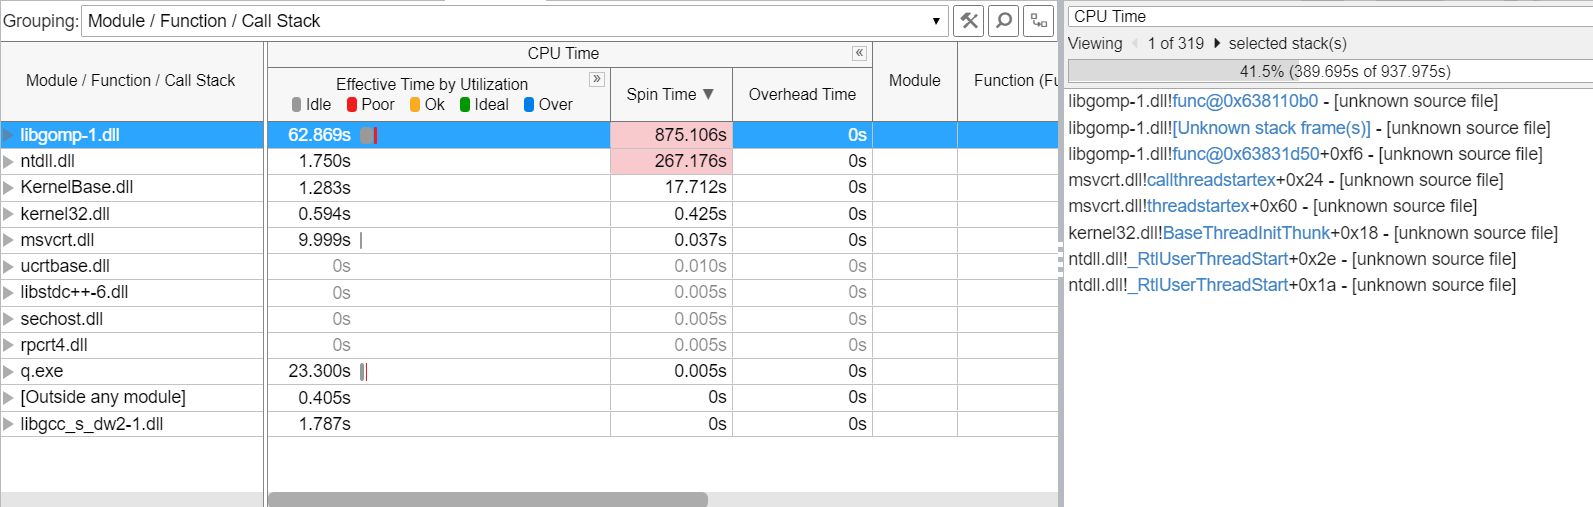
I am trying to profile a C++ application with OpenMP using Intel Vtune Profiler. According to Intel Tutorial (https://software.intel.com/en-us/download/tutorial-finding-hotspots-c-sample-application-windows) I have run Hotspots Analysis and found the most time-consuming functions. In the tutorial functions' sources are shown in the Call Stack pane (see "guide" picture). However, in my case in the Call Stack pane it is written that almost all of functions have [unknown source file], so I can't find their source (see "reality" picture).
Tell me, please what should I do to find the source of these functions?
Many thanks! :)
P.S. I have compiled this application (q.exe) using NetBeans with MinGW. I have tried to run Hotspots Analysis in both Debug and Release modes, but still have no success.
Link Copied
- Mark as New
- Bookmark
- Subscribe
- Mute
- Subscribe to RSS Feed
- Permalink
- Report Inappropriate Content
Grigorii,
For MinGW binaries VTune expects debugging information in DWARF format. Make sure your application is built with -g or -gdwarf-version option. You can find more details here: https://software.intel.com/en-us/vtune-help-debug-info-for-linux-binaries.
- Mark as New
- Bookmark
- Subscribe
- Mute
- Subscribe to RSS Feed
- Permalink
- Report Inappropriate Content
Dear Denis Mochanov,
Thank you very much for your help! I have checked compiler options and it has -g one. I have added -gdwarf-4 and some of functions have their source now.
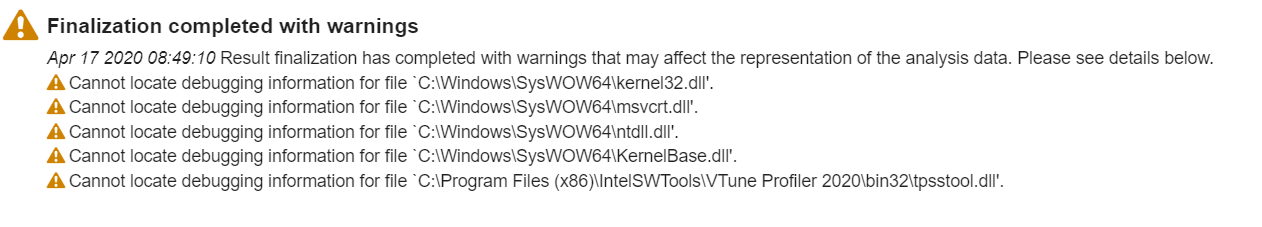
However, most of them (for example, the most time-consuming in the "reality" picture) still have [unknown source file]. Also, I have a list of warnings after I had run Hotspot Analysis (see "warnings" picture). (I haven't mentioned it, I have Windows 10)
I've read here https://software.intel.com/en-us/vtune-help-debug-information-for-windows-application-binaries that for windows binaries VTune expects debugging information in PDB format. But I haven't found information about how to enable it in NetBeans.
- Mark as New
- Bookmark
- Subscribe
- Mute
- Subscribe to RSS Feed
- Permalink
- Report Inappropriate Content
.PDB files are needed for native Windows binaries, not MingGW ones.
Warnings on the last picture are about system libraries. System libraries usually do not have debugging information and you can ignore them but there is a way to download .PDBs for WIndows system binaries: https://software.intel.com/en-us/vtune-help-debug-information-for-windows-system-libraries.
I guess libgomp-1 also doesn't have debug info; its debug version is needed to get sybmols and source locations.
- Mark as New
- Bookmark
- Subscribe
- Mute
- Subscribe to RSS Feed
- Permalink
- Report Inappropriate Content
Dear Denis Mochanov,
Thank you for your reply!
I have tried to download PDBs for Windows like in the way you mentioned (options 2,3) and most of warnings have disappeared (now I only have the last one). However, functions still have [unknown source file] in both Debug and Release modes with different compiler options.
I also kindly ask to help me to find debug versions of libgomp-1.dll for Windows.
- Mark as New
- Bookmark
- Subscribe
- Mute
- Subscribe to RSS Feed
- Permalink
- Report Inappropriate Content
What binary module has "unknown source file" for functions? If it is your module built with debug information, could you share a reproducer: the module, its .pdb file (if it exists), build options and VTune result.
If system modules do not have source line information and there are no warnings about them in VTune finalization log, that likely means .PDBs do not have information about source locations.
As for libgomp-1.dll, I would suggest contacting the library vendor.
And do you really want to profile system modules? Having debug information for modules of a user application is usually enough.
- Mark as New
- Bookmark
- Subscribe
- Mute
- Subscribe to RSS Feed
- Permalink
- Report Inappropriate Content
Dear Denis Mochanov,
Thank you for your reply!
There are several modules which have [unknown source file] everywhere or partly - see "modules" picture (it is another example of Hotspot Analysis of this application). The application (q.exe) itself has little [unknown source file], but I think it is not important, most of the functions from the application have their source file.
I don't want to profile system modules, but I want to understand which parts of the source code I should change to optimize the application. The most-time consuming functions are not from source .cpp files (see the "reality" picture in my first post).
I think that the idea is to determine which functions are the most time-consuming and then change code (use another functions/change algorithm so that these functions are called less times/rewrite the code in a completely different way).
- Mark as New
- Bookmark
- Subscribe
- Mute
- Subscribe to RSS Feed
- Permalink
- Report Inappropriate Content
Your application spends much time in libgomp library. That could be caused by several reasons, some of them are described in the following article: https://software.intel.com/en-us/vtune-cookbook-openmp-code-analysis-method.
Debug information for libgomp might help to understand what happens.
- Mark as New
- Bookmark
- Subscribe
- Mute
- Subscribe to RSS Feed
- Permalink
- Report Inappropriate Content
Dear Denis Mochanov,
Thank you for your reply!
This article starts with "To analyze OpenMP parallel regions, make sure to compile and run your code with the Intel® Compiler 13.1 Update 2 or higher", but I compile my application using MinGW on Windows. But then there is an example about how to install GCC debug information on Fedora. Is there a similar way to do it in Windows for MinGW?
I am trying to find debug versions of libgomp (for example, in the MinGW installation manager), but still have no success. It is the best of what I've found: https://reposcope.com/package/libgomp1-debuginfo, but it is for OpenSUSE.
P.S. I've tried to run Threading analysis to inspect OpenMP part of the program, but have reached limit of 1000 MB in a few minutes.
- Mark as New
- Bookmark
- Subscribe
- Mute
- Subscribe to RSS Feed
- Permalink
- Report Inappropriate Content
Hi,
Is your issue resolved?Would you like us to forward the case to SME?
- Mark as New
- Bookmark
- Subscribe
- Mute
- Subscribe to RSS Feed
- Permalink
- Report Inappropriate Content
Hi!
Unfortunately, the problem hasn't been completely solved :(
I am trying to use other ways to figure out how I should change the code.
Please tell what is SME? :)
- Mark as New
- Bookmark
- Subscribe
- Mute
- Subscribe to RSS Feed
- Permalink
- Report Inappropriate Content
Hi,
SME is Subject Matter Expert.Since your issue is not resolved we are forwarding the case to SME.
Thanks.
- Mark as New
- Bookmark
- Subscribe
- Mute
- Subscribe to RSS Feed
- Permalink
- Report Inappropriate Content
Hello
1. as Denis wrote you need to compile _your_ program with debug info.
2. "reality.png" shows that the problem is on barrier overhead inside openmp runtime. do you have enough compute inside the parallel region?
Vladimir
- Subscribe to RSS Feed
- Mark Topic as New
- Mark Topic as Read
- Float this Topic for Current User
- Bookmark
- Subscribe
- Printer Friendly Page