- Mark as New
- Bookmark
- Subscribe
- Mute
- Subscribe to RSS Feed
- Permalink
- Report Inappropriate Content
Hello there.
I have a parallel application and I am profiling it with VTune Amp. XE 2015 on Ubuntu 14.10. My goal at this moment is to check how much time (and in which way / pattern) the threads of the program are executing in parallel (i.e., I want to analyze the concurrency of the program). However, I am seeing some results that I do not understand.
It all has to do with: [set] thread affinity x concurrency analysis x advanced hotspot analysis.
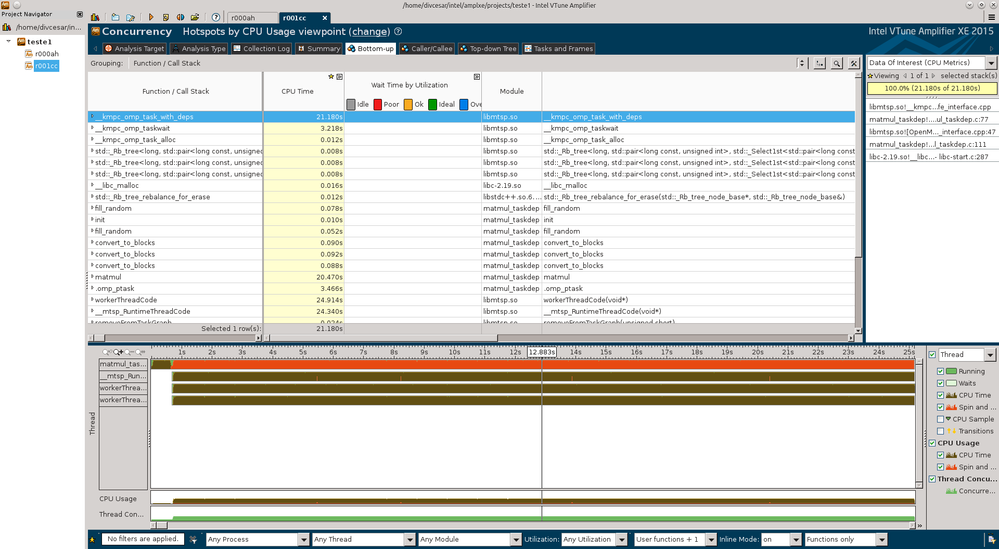
With thread affinity disabled and doing concurrency analysis in VTune I see the following concurrency histogram:
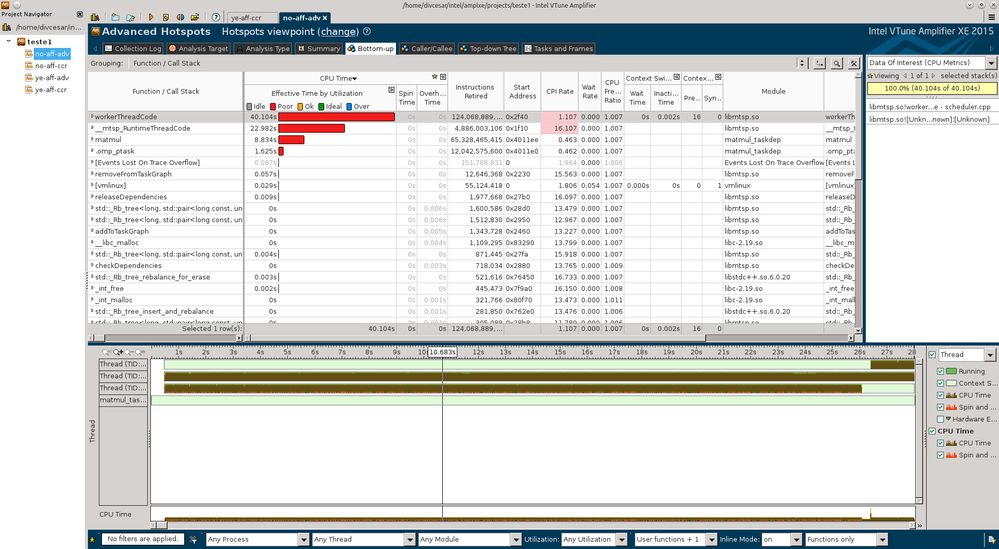
With thread affinity disabled and doing advanced hotspot analysis in VTune I see the following concurrency histogram:
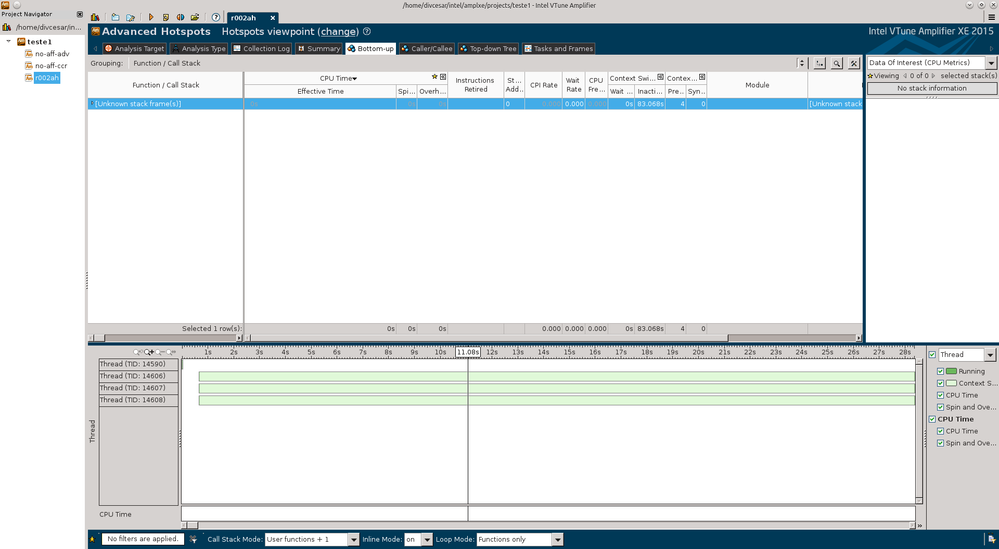
With thread affinity enabled and doing advanced hotspot analysis in VTune I see the following concurrency histogram:
So my questions are:
Why concurrency histogram (i.e., the graph at the bottom of the screen) is correct?
How could my threads be preempted for the whole execution of the program?
The concurrency analysis does not even mention about preemption/context switching...
PS:
I am getting the following message in the advanced hotspot analysis: "Events lost on trace overflow.ko"
If I do a basic hotspot analysis the histogram is different from the above ones.
The histogram is consistent when I execute the same analysis multiple times.
Link Copied
- Mark as New
- Bookmark
- Subscribe
- Mute
- Subscribe to RSS Feed
- Permalink
- Report Inappropriate Content
>Why concurrency histogram (i.e., the graph at the bottom of the screen) is correct?
Both of hot functions are in libmtsp.so - i don't know if this library has debug info. If not, only APIs (functions) can be displayed in report.
1. Use "User/System functions" in Call stack mode (at bottom of report), so some system function calls will not missed
2. Use "-knob collection-detail=stack-sampling", so call stack info will not missed.
3. Concurrency histogram had hot function, which were spinning; Advanced-hotspots histogram indicated that hot function is in thread-scheduler. Note that user-level profiling (Concurrency, basic hotspots - for example) only displays hot function in user modules - as default.
... my threads be preempted for the whole execution... - I have no other idea, you may set high priority of threads from normal?
...concurrency analysis does not even mention about preemption/context switching... - this analysis focuses on hot functions in parallel. You may pay attentions of CPU usage to know if performance is better or worse. The cost of context switch depends on OS scheduler, you can use Locksandwait analysis to find "locks" on cost and view how they caused treads' stall, try to reduce: 1) adjust algorithm to reduce "locks", 2) reduce use of "locks" 3) change critical area to small.
- Mark as New
- Bookmark
- Subscribe
- Mute
- Subscribe to RSS Feed
- Permalink
- Report Inappropriate Content
Hi Peter, thank you for the answer.
- Both the library and the program were compiled with gcc and -g flag.
1. Use "User/System functions" in Call stack mode (at bottom of report), so some system function calls will not missed
2. Use "-knob collection-detail=stack-sampling", so call stack info will not missed.
The items above did not change anything in the concurrency graph.
3. Concurrency histogram had hot function, which were spinning; Advanced-hotspots histogram indicated that hot function is in thread-scheduler. Note that user-level profiling (Concurrency, basic hotspots - for example) only displays hot function in user modules - as default.
Actually I know which are the hotspots, what puzzled me was VTune telling that threads might not, in fact, be working in parallel. And currently I don't know if this is a problem in my application, in the OS or with VTune...
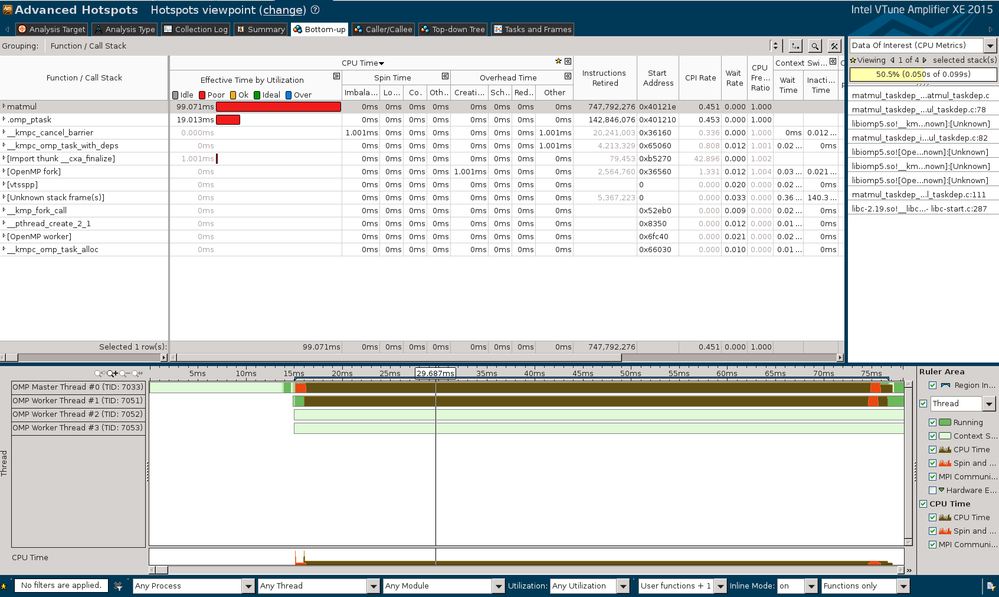
Addendum. I am working on a mini implementation of an OpenMP runtime. To test if these "inconsistencies in the concurrency histogram" were being caused by something in my library I executed the same program as before (matrix multiplication) but this time the program was linked with the Intel IOMP. The results are the same; please see below.
Using the advanced hotspot analysis (with -knob collection-detail-stack-sampling) analysis:
- Mark as New
- Bookmark
- Subscribe
- Mute
- Subscribe to RSS Feed
- Permalink
- Report Inappropriate Content
Hello Caesar,
Concurreny analysis type is based on user level sampling collector with instrumentation and it defines waits from threading API instrumentation etc.
Advanced Hotspot analysis type is based on drives-based collection and it catches context switches allowing to see where the thread was inactive either from preemption or syncronization.
It is necessary to switch "Analyze Intel runtimes and synchronization" in concurrency analysis configuration to have closer picture of two analysis.
I would suggest to enable the switch and recheck the results.
For the advanced-hotspots result with affinity applied. Could you please collect advanced-hotspots without stacks and provide the view also?
I would also recommend to use the latest VTune 2015 Update 4 or 2016 Beta and do advanced hotspots analysis of your program with 2015 Update 2 or later compiler update. In this case you will be able to see OpenMP specific efficiency analysis as it described in https://software.intel.com/en-us/node/544172
Thanks & Regards, Dmitry
- Subscribe to RSS Feed
- Mark Topic as New
- Mark Topic as Read
- Float this Topic for Current User
- Bookmark
- Subscribe
- Printer Friendly Page


