- Mark as New
- Bookmark
- Subscribe
- Mute
- Subscribe to RSS Feed
- Permalink
- Report Inappropriate Content
Hello,
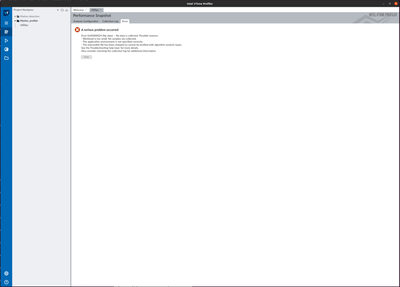
I'm trying to profile my application but I've got an error saying that "Data file is corrupted!"
here is a screnshot of the error section:
I'm running vtune for the first time on ubuntu 20.04.
When run the vtune-gui I got an Error message:
[270648:0126/195000.308639:ERROR:cert_verify_proc_builtin.cc(690)] CertVerifyProcBuiltin for 127.0.0.1 failed:
----- Certificate i=0 (CN=jaouadros) -----
ERROR: No matching issuer found
- Mark as New
- Bookmark
- Subscribe
- Mute
- Subscribe to RSS Feed
- Permalink
- Report Inappropriate Content
Link Copied
- Mark as New
- Bookmark
- Subscribe
- Mute
- Subscribe to RSS Feed
- Permalink
- Report Inappropriate Content
Hi,
Thank you for posting in Intel Communities.
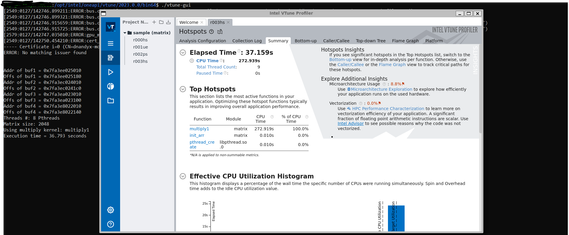
We tried opening Vtune-GUI from our side on a Linux system(Ubuntu 20.04.5) and it was running fine(Please refer to screenshot)
The error you are getting regarding the certificate issue can be ignored since Vtune is running locally.
Since we are unable to replicate your issue from our side can you get back to us with the following information:
1. Processor details
2. Sample reproducer code(A code similar to your code that replicates the issue) on which you are performing the analysis.
3. The exact steps you followed and the type of analysis you are performing.
4. The output of the self-checker logs. This can be obtained by running the below command:
<Vtune_installation_directory\2023.0.0\bin64\vtune-self-checker.sh>example: /opt/intel/oneapi/vtune/2023.0.0/bin64/vtune-self-checker.sh
Regards,
Diya
- Mark as New
- Bookmark
- Subscribe
- Mute
- Subscribe to RSS Feed
- Permalink
- Report Inappropriate Content
Hello,
I'd recommend to increase application execution time (i.e. make it run longer) or specify lower sampling rate in your project settings
- Mark as New
- Bookmark
- Subscribe
- Mute
- Subscribe to RSS Feed
- Permalink
- Report Inappropriate Content
Thank you, now I get some data but still getting errors. Here is the output of the vtune-self-checker.sh:
Intel(R) VTune(TM) Profiler Self Check Utility
Copyright (C) 2009 Intel Corporation. All rights reserved.
Build Number: 624757

HW event-based analysis (counting mode)
Example of analysis types: Performance Snapshot
Collection: Ok
Finalization: Ok...
Report: Ok

Instrumentation based analysis check
Example of analysis types: Hotspots and Threading with user-mode sampling
Collection: Ok
vtune: Warning: Microarchitecture performance insights will not be available. Make sure the sampling driver is installed and enabled on your system.
Finalization: Ok...
Report: Ok

HW event-based analysis check
Example of analysis types: Hotspots with HW event-based sampling, HPC Performance Characterization, etc.
Collection: Fail
vtune: Error: Current OS kernel does not support driverless collection on hybrid CPUs. Consider loading the VTune Profiler sampling driver using root credentials or updating the OS kernel.
vtune: Warning: Access to /proc/kallsyms file is limited. Consider changing /proc/sys/kernel/kptr_restrict to 0 to enable resolution of OS kernel and kernel module symbols.

HW event-based analysis check
Example of analysis types: Microarchitecture Exploration
Collection: Fail
vtune: Error: Current OS kernel does not support driverless collection on hybrid CPUs. Consider loading the VTune Profiler sampling driver using root credentials or updating the OS kernel.
vtune: Warning: Access to /proc/kallsyms file is limited. Consider changing /proc/sys/kernel/kptr_restrict to 0 to enable resolution of OS kernel and kernel module symbols.

HW event-based analysis with uncore events
Example of analysis types: Memory Access
Collection: Fail
vtune: Error: Cannot collect memory bandwidth data. Make sure the sampling driver is installed and enabled on your system. See the Sampling Drivers help topic for more details. Note that memory bandwidth collection is not possible if you are profiling inside a virtualized environment.

HW event-based analysis with stacks
Example of analysis types: Hotspots with HW event-based sampling and call stacks
Collection: Fail
vtune: Error: Current OS kernel does not support driverless collection on hybrid CPUs. Consider loading the VTune Profiler sampling driver using root credentials or updating the OS kernel.
vtune: Warning: Access to /proc/kallsyms file is limited. Consider changing /proc/sys/kernel/kptr_restrict to 0 to enable resolution of OS kernel and kernel module symbols.
vtune: Error: Unlimited stack size (0) not allowed in driverless mode.

HW event-based analysis with context switches
Example of analysis types: Threading with HW event-based sampling
Collection: Fail
vtune: Error: Current OS kernel does not support driverless collection on hybrid CPUs. Consider loading the VTune Profiler sampling driver using root credentials or updating the OS kernel.
vtune: Warning: Access to /proc/kallsyms file is limited. Consider changing /proc/sys/kernel/kptr_restrict to 0 to enable resolution of OS kernel and kernel module symbols.
vtune: Warning: Context switch data cannot be collected in the current driverless mode if the kernel version is less than 4.3 or /proc/sys/kernel/perf_event_paranoid value is greater than 1. Update your system configuration for or consider switching to the Intel sampling driver by setting an unlimited (0) value for the Stack size option.

vtune: Warning: VTune Profiler driver with insufficient permission is detected on the system.
vtune: Warning: Consider setting proper driver permissions (see the "Sampling Drivers" help topic).
vtune: Warning: Otherwise, the driverless collection with limited analysis support will be enabled by default.

Checking DPC++ application as prerequisite for GPU analyses: Fail
Unable to run DPC++ application on GPU connected to this system. If you are using an Intel GPU and want to verify profiling support for DPC++ applications, check these requirements:
* Install Intel(R) GPU driver.
* Install Intel(R) Level Zero GPU runtime.
* Install Intel(R) oneAPI DPC++ Runtime and set the environment.

The check observed a product failure on your system.
Review errors in the output above to fix a problem or contact Intel technical support.

The system is ready for the following analyses:
* Performance Snapshot
* Hotspots and Threading with user-mode sampling

The following analyses have failed on the system:
* Hotspots with HW event-based sampling, HPC Performance Characterization, etc.
* Microarchitecture Exploration
* Memory Access
* Hotspots with HW event-based sampling and call stacks
* Threading with HW event-based sampling
* GPU Compute/Media Hotspots (characterization mode)
* GPU Compute/Media Hotspots (source analysis mode)
Here is my kernel version:
Linux jaouadros 5.15.0-58-generic #64~20.04.1-Ubuntu SMP Fri Jan 6 16:42:31 UTC 2023 x86_64 x86_64 x86_64 GNU/Linux
- Mark as New
- Bookmark
- Subscribe
- Mute
- Subscribe to RSS Feed
- Permalink
- Report Inappropriate Content
- Mark as New
- Bookmark
- Subscribe
- Mute
- Subscribe to RSS Feed
- Permalink
- Report Inappropriate Content
Hi,
Glad to know that your issue is resolved.
If you need any additional information, please post a new question as this thread will no longer be monitored by Intel.
Regards,
Diya
- Subscribe to RSS Feed
- Mark Topic as New
- Mark Topic as Read
- Float this Topic for Current User
- Bookmark
- Subscribe
- Printer Friendly Page

