- Mark as New
- Bookmark
- Subscribe
- Mute
- Subscribe to RSS Feed
- Permalink
- Report Inappropriate Content
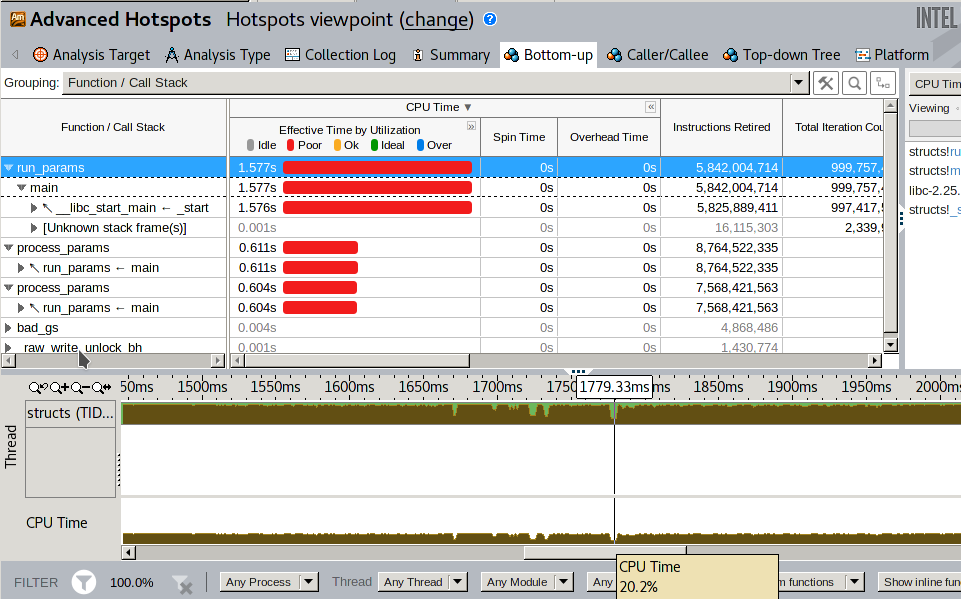
I can see a low cpu time in some regions of the timeline [vtune cpu time low image][1].
I know how to select the region and do "filter in by selection", so the "function / call stack" lines above are updated to the region (and only the first "run_params" and "process_params") are shown.
The code is simple: run_params has a loop of 999999999 iterations that calls process_params with different params every 2 iterations. Small part:
   void
    run_params(int times){
      // ...

      for (size_t i=0; i<times; i++){
        if (i % 2 == 0){
          process_params(&integer1, &integer2, &fp_single1, &fp_single2, &fp_double1, &fp_double2, &ptr_a1, &ptr_a2, &ptr_b1, &ptr_b2, i % 3);
        }else{
          process_params(&integer2, &integer1, &fp_single2, &fp_single1, &fp_double2, &fp_double1, &ptr_a2, &ptr_a1, &ptr_b2, &ptr_b1, i % 3);
        }
      }

      // ...
    }
Questions:
1. How can I see why the cpu time is so low in those regions?
2. How can I see which source code lines are executed in a specific time (or region in timeline)?
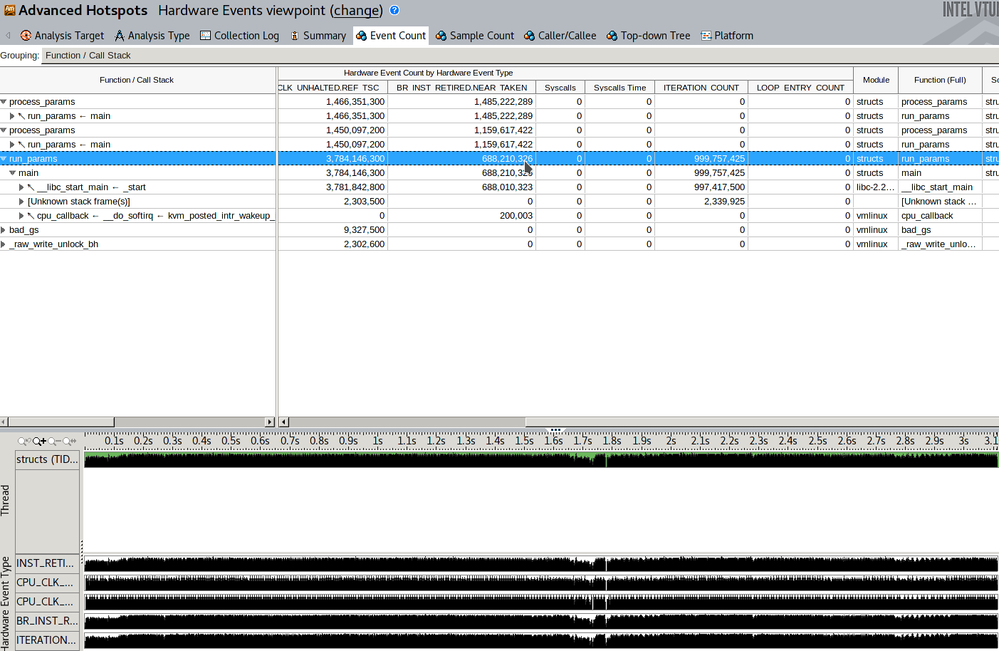
3. I have only one function "process_params" (although it is called from two different source code lines inside the "run_params" func). Why I get two different functions/call stack called "process_params"?
4. I have a loop of 999999999 iterations inside the run_params function, that calls process_params that number of times. Why I get weird iteration counts? (never seen the 999999999 number in the VTune). What should I do to see the number of times process_params is called? Also, it is shown in a column of the run_params function (why?), but no in process_params.[iterations image][2]
[1]: vtune cpu time low image
[2]: iterations image
Link Copied
- Subscribe to RSS Feed
- Mark Topic as New
- Mark Topic as Read
- Float this Topic for Current User
- Bookmark
- Subscribe
- Printer Friendly Page

