- Mark as New
- Bookmark
- Subscribe
- Mute
- Subscribe to RSS Feed
- Permalink
- Report Inappropriate Content
TLDR;
-----
I am attempting to run a command line vtune attach to process analysis for some instrumented code with the application instrumentation lib supplied by intel. I have succeeded, in collecting user events when running within the vtune application (both command line and GUI). When I use `-target-pid` command line option to connect to the same application, user events do not show up in the profile. The environment setup suggested in the instructions for attaching to a process does not work.
## The long version ##
I have broken this down again and again, and i have hit the minimum amount of things going on here. I am running Ubuntu 20.04 with intel vtune installed as part of the oneapi installer package. I have built an example application, which i can share, but it basically spawns threads and does some random computations. I have instrumented the code with `itt` as such:
#include <ittnotify.h>

__itt_event cloud_in_event = __itt_event_create( "CloudIn", 7 );

...

void add() {
__itt_event_start( cloud_in_event );
...
This works correctly when run through the gui. Aka, i compile my application with the following:
g++ -g -O3 -fno-asm -std=c++17 -I/opt/intel/oneapi/vtune/latest/sdk/include -DUSE_THR example.cpp -g -o ./example -lpthread -lm -L/opt/intel/oneapi/vtune/2021.4.0/sdk/lib64 -littnotify -ldl -D_LINUXI start the gui using:
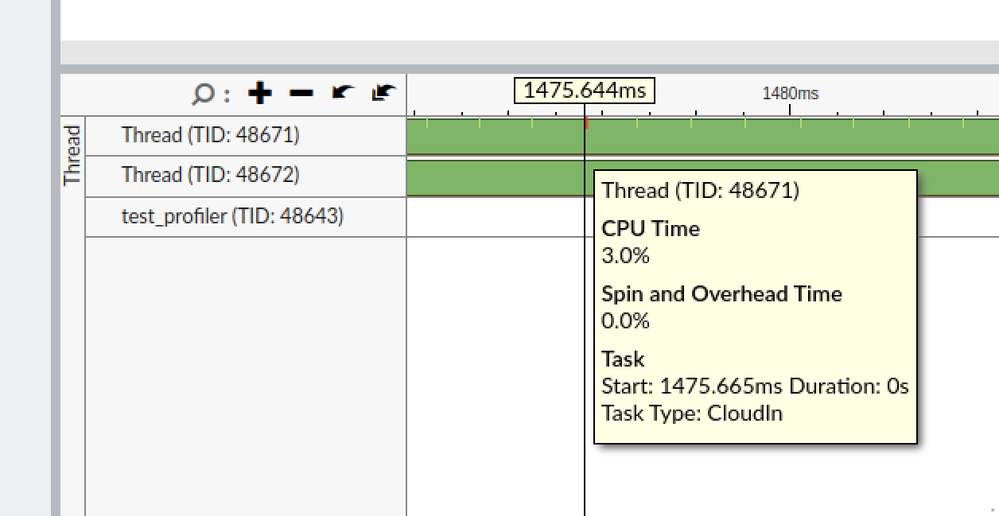
. /opt/intel/oneapi/setvars.sh && vtune-gui &Run it using the cpu hotspot analysis in hw mode. The application runs and i get this in the output:
Yay, my user event is there. All is well.
The equivalent command line also works:
/opt/intel/oneapi/vtune/2021.4.0/bin64/vtune -collect hotspots -knob sampling-mode=hw -knob stack-size=0 -app-working-dir /home/development/example/example --app-working-dir=/home/development/example/example -- /home/development/hovermap/example/exampleHowever, if i run the application on its own (using the correct setup for the link path in the environment variables for `INTEL_LIBITTNOTIF`), then attach with the GUI to that process (or with the command line). There are no user events (aka, the `CloudIn` event in the above image) in the profiler data.
If I print out the environment variables in the application, there are quite vast differences in the environments when profiling directly, vs when attaching. For example, there is the following:
INTEL_JIT_PROFILER32=/opt/intel/oneapi/vtune/2021.4.0/lib32/runtime/libittnotify_collector.so
INTEL_JIT_PROFILER64=/opt/intel/oneapi/vtune/2021.4.0/lib64/runtime/libittnotify_collector.so
ENABLE_JITPROFILING=1
Exists in the gui based run environment, but the setup instructional says nothing about these environment variables. I have also tried setting them with no luck.
Any ideas what extra stuff i need to set up?
Link Copied
- Mark as New
- Bookmark
- Subscribe
- Mute
- Subscribe to RSS Feed
- Permalink
- Report Inappropriate Content
Hi,
Thanks for reaching out to us.
We are working on it internally, will get back to you soon.
Could you please share the sample reproducer so that we can try out the same from our end.?
Thanks.
- Mark as New
- Bookmark
- Subscribe
- Mute
- Subscribe to RSS Feed
- Permalink
- Report Inappropriate Content
Sure, here is the code that i run:
#include <thread>
#include <mutex>
#include <chrono>
#include <iostream>
#include <atomic>
#include <vector>
#include <limits>
#include <ittnotify.h>

__itt_event cloud_in_event = __itt_event_create( "CloudIn", 7 );

using namespace std::chrono_literals;

std::vector<uint64_t> some_storage;

auto fibonachi() {
    uint64_t i = 1, i_prev = 1;
    while (i < 1000000) {
        auto temp = i;
        i += i_prev;
        i_prev = temp;
        if (i % 2) {
            some_storage.push_back(i);
        }
    }

    return i;
}


struct Counter {

    void add() {

         __itt_event_start( cloud_in_event );
        std::scoped_lock sl(lock);
        fibonachi();
        count++;
    }

    int get() const {


         __itt_event_start( cloud_in_event );

        std::scoped_lock sl(lock);
        uint64_t sum = 0;
        for (auto i : some_storage) {
            sum += i;
        }

        return count + sum;
    }

    mutable std::mutex lock;
    volatile int count = 0;
};


int main(int, char **, char **envp)
{

    std::cout << "\n\n=========================================";
    for (char **env = envp; *env != 0; env++)
    {
        std::string enviro = *env;
        std::cout << enviro << std::endl;
    }
    std::cout << "=========================================\n\n";


    std::atomic_bool is_finished = false;

    Counter c;
    std::thread incrementor([&](){
        while (!is_finished) {
            c.add();
            std::this_thread::sleep_for(1ms);
        }
    });
    std::thread printer([&](){
        while (!is_finished) {
            std::cout << c.get() << std::endl;
            std::this_thread::sleep_for(50ms);
        }
    });

    std::this_thread::sleep_for(500s);

    is_finished = true;
    incrementor.join();
    printer.join();

    return 0;

}
I have also attached the environment variables for both cases of running:
from_attach.txt - the result of export run from where the application is run standalon (with the expectation that i will attach to it afterwards)
from_run_through_gui.txt - the result of export, run from the application when run through the gui.
As a reminder, this all works when running through the gui or running from command line, but not when attaching using:
vtune --collect hotspots -knob sampling-mode=hw -knob stack-size=0 -target-pid $(ps -ef | grep example | head -n 1 | awk '{print $2}') -result-dir /home/user/development/profiling/test_01
- Mark as New
- Bookmark
- Subscribe
- Mute
- Subscribe to RSS Feed
- Permalink
- Report Inappropriate Content
Hi,
Thanks for sharing the sample reproducer.
We are working on it internally, will get back to you with an update.
Thanks.
- Mark as New
- Bookmark
- Subscribe
- Mute
- Subscribe to RSS Feed
- Permalink
- Report Inappropriate Content
Hi,
We tried in Ubuntu 20.04 with Vtune 2021.5 and we were able to run the sample.
Could you please try to update the Vtune to the latest version and try again.
Also share the difference observed in environment variables and the commands used to print out the environment variables.
Thanks
- Mark as New
- Bookmark
- Subscribe
- Mute
- Subscribe to RSS Feed
- Permalink
- Report Inappropriate Content
Hi, thanks for looking into it.
> We tried in Ubuntu 20.04 with Vtune 2021.5 and we were able to run the sample
Please be specific. When you say we were able to run the sample. Do you mean that you were able to run the application above in an environment and then attach to it from the gui using the `-attach-pid` argument from a different terminal?
This is what i am trying to achieve. If i run the application directly, that i can correctly collect user tasks.
As requested i have compiled and run this now with Vtune 2021.5.0 with the same results. To repeat the above that is:
1. I can get user events in the profiler when i run the application directly from the GUI.
2. I can not get user events when i run the application stand-alone, then attach to it from the GUI.
Attached are the environment variables from each run. In order to get these you can see in the application the following code:
int main(int, char **, char **envp)
{

    std::cout << "\n\n=========================================";
    for (char **env = envp; *env != 0; env++)
    {
        std::string enviro = *env;
        std::cout << enviro << std::endl;
    }
    std::cout << "=========================================\n\n";
This will print out the environment variables in each of the cases.
- Mark as New
- Bookmark
- Subscribe
- Mute
- Subscribe to RSS Feed
- Permalink
- Report Inappropriate Content
Hi,
Sorry for the confusion, we were able to generate the vtune reports using attached process option. However as you mentioned, the user events are missing. We are checking on this internally and will get back to you with an update.
Thanks
- Mark as New
- Bookmark
- Subscribe
- Mute
- Subscribe to RSS Feed
- Permalink
- Report Inappropriate Content
Hello,
Could it be possible that by time you attached to a PID, the events have already happened and you are collecting just the rest of your execution (e.g. in a sleep(500) call)? I'd "debug" such case by calling a "heavy" function after all events, and observe its beginning in the results (filtered-in on a timeline).
- Mark as New
- Bookmark
- Subscribe
- Mute
- Subscribe to RSS Feed
- Permalink
- Report Inappropriate Content
Hi Vladimir,
This is not an issue. Your counterpart (Athira) has already expressed that they have reproduced the issue. But to be complete lets walk through some parts of the example code:
1. Look at the layout, it is quite simple, in main we have:
std::atomic_bool is_finished = false;

// Set up a counter thread

// Set up a printer thread

std::this_thread::sleep_for(500s);

// Joint the 2 threads
This means that the program runs for 500 seconds. It would be quite hard for me to miss the program itself.
2. The events occur in the second thread:
while (!is_finished) {
        std::cout << c.get() << std::endl;
        std::this_thread::sleep_for(50ms);
}
where `get` does:
__itt_event_start( cloud_in_event );So a rundown here is that we loop for the length of the program (aka 500s as explained above), and we do get every 50ms. That means an event is fired every 50ms until the end of the program. This is confirmed by the print to screen which we also see.
Again, this works fully when run in command line like `vtune -collect hotspots example` or from the gui. But when attaching using `-attach pid` we get the profile and we can see the function `get` being called. But no user event is seen.
- Mark as New
- Bookmark
- Subscribe
- Mute
- Subscribe to RSS Feed
- Permalink
- Report Inappropriate Content
Sorry, I didn't compile/run your example, but looking at your source code I do not see any int __itt_event_end() call. Most probably the very first __itt_event_start() call happened before attachment with VTune, and the rest of __itt_event_start() call didn't have any affect. So, that's why you might observe only one event mark on the timeline when launched the example under VTune.
The itt_event is global, so it's expecting start and end in any thread:
int __itt_event_end( __itt_event event );
Call this API following a call to __itt_event_start() to show the event as a tick mark with a duration line from start to end. If this API is not called, this event appears in the Timeline pane as a single tick mark.
- Mark as New
- Bookmark
- Subscribe
- Mute
- Subscribe to RSS Feed
- Permalink
- Report Inappropriate Content
Hello,
Just curious, did it help?
- Mark as New
- Bookmark
- Subscribe
- Mute
- Subscribe to RSS Feed
- Permalink
- Report Inappropriate Content
Hi Vladimir, I have just tested it and it did not help.
I changed the function with the user task to:
   void add() {

         __itt_event_start( cloud_in_event );
        std::scoped_lock sl(lock);
        fibonachi();
        count++;
         __itt_event_end( cloud_in_event );
    }
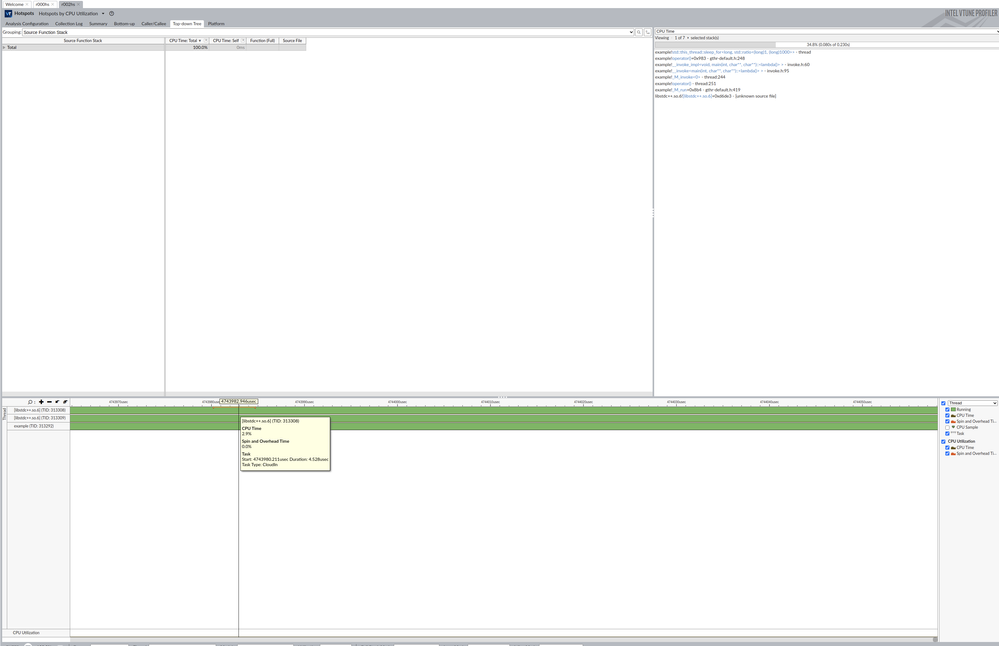
You can see that we now do beginning and end. As before, if i run the application directly from the gui or using `vtune -collect hotspots example` in the command line, then i get the user events. Now they are longer as well, I guess because they have a beginning and an end:
But, if i use the gui (or the command line) to attach to the already running process, these events do not appear.
- Mark as New
- Bookmark
- Subscribe
- Mute
- Subscribe to RSS Feed
- Permalink
- Report Inappropriate Content
I do observe this problem as well. The development team is taking a look at a bug i submitted along with your reproducer. Thanks for that!
One more problem that I came across is that even in a launch mode, in case of stopping collection with Ctrl+C, user tasks do not show up in results as well. Submitted.
- Mark as New
- Bookmark
- Subscribe
- Mute
- Subscribe to RSS Feed
- Permalink
- Report Inappropriate Content
Hello,
Has there been any update on this bug? I have also just encountered it.
Many thanks to FantasticMrFox for the documentation which helped me isolate the problem.
Thanks,
- Mark as New
- Bookmark
- Subscribe
- Mute
- Subscribe to RSS Feed
- Permalink
- Report Inappropriate Content
Hello,
As far as I can see, the bug has not been fixed yet. Sorry.
- Mark as New
- Bookmark
- Subscribe
- Mute
- Subscribe to RSS Feed
- Permalink
- Report Inappropriate Content
Hello,
This is not planned to be fixed in the near future.
However, as a workaround, you can use ITT API user tasks (instead of events) with attach to PID.
For more details on ITT user tasks, see https://www.intel.com/content/www/us/en/develop/documentation/vtune-help/top/api-support/instrumentation-and-tracing-technology-apis/instrumentation-tracing-technology-api-reference/task-api.html
- Mark as New
- Bookmark
- Subscribe
- Mute
- Subscribe to RSS Feed
- Permalink
- Report Inappropriate Content
As mentioned previously, this will not be fixed.
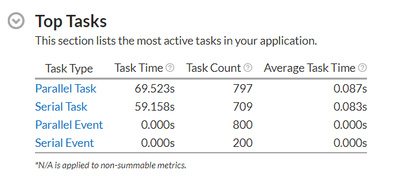
The workaround is to use ITT API user tasks instead of events. See my sample output below.
The event time is not recorded, which is why it does not appear in the GUI timeline display.
vtune 2023.1.0 command line output includes:
Top Tasks
Task Type Task Time Task Count Average Task Time
-------------- --------- ---------- -----------------
Parallel Task 69.523s 797 0.087s
Serial Task 59.158s 709 0.083s
Parallel Event 0.000s 800 0.000s
Serial Event 0.000s 200 0.000s
- Subscribe to RSS Feed
- Mark Topic as New
- Mark Topic as Read
- Float this Topic for Current User
- Bookmark
- Subscribe
- Printer Friendly Page


