- Mark as New
- Bookmark
- Subscribe
- Mute
- Subscribe to RSS Feed
- Permalink
- Report Inappropriate Content
I am running the svm application on intel vtune for hotspot analysis. The input file size is 2GB. The application run fine however the hotspot analysis on intel vtune GUI just provides the following summary information:
Collection and Platform Info
Application Command Line: /usr/local/hadoop/scr_svm
Operating System: 3.8.0-19-generic DISTRIB_ID=Ubuntu
DISTRIB_RELEASE=13.04
DISTRIB_CODENAME=raring
DISTRIB_DESCRIPTION="Ubuntu 13.04"
Computer Name: HH-Xeon
Result Size: 933 MB
CPU
Name: Intel(R) Xeon(R) E5 processor
Logical CPU Count: 24
No bottom-up analysis is created that shows the modules and the functions for hotspot. In analysis type tab of intel vtune, I have used parameter "duration time estimate: over 3 hours".
Can you please explain, why I am not getting hotspot information?
Thanks
Link Copied
- Mark as New
- Bookmark
- Subscribe
- Mute
- Subscribe to RSS Feed
- Permalink
- Report Inappropriate Content
Hi Maria!
Can you please post screenshot of VTune GUI when analysis completed?
Also, can you please provide output of the following commands:
> amplxe-cl -R summary -r <path_to_result>
> amplxe-cl -R hotspots -r <path_to_result>
For the last one I only need to know does it print the list of functions or not.
- Mark as New
- Bookmark
- Subscribe
- Mute
- Subscribe to RSS Feed
- Permalink
- Report Inappropriate Content
First Command output:
amplxe-cl -R summary -r intel/amplxe/projects/fccm_hotspot/r005ah/
amplxe: Using result path `/home/hduser/intel/amplxe/projects/fccm_hotspot/r005ah'
amplxe: Executing actions 50 % Generating a report
Collection and Platform Info
----------------------------
Parameter r005ah
------------------------ ----------------------------
Application Command Line /usr/local/hadoop/scr_kmean
Operating System Linux
Computer Name HH-Xeon
Result Size 3878111
CPU
---
Parameter r005ah
----------------- -----------------------------
Name Intel(R) Xeon(R) E5 processor
Logical CPU Count 1
Summary
-------
Elapsed Time: 2.120
amplxe: Executing actions 100 % done
Second Command output:
amplxe-cl -R hotspots -r intel/amplxe/projects/fccm_hotspot/r005ah/
amplxe: Using result path `/home/hduser/intel/amplxe/projects/fccm_hotspot/r005ah'
amplxe: Executing actions 50 % Generating a report
This result does not have data that can be displayed with the following specified 'group-by' argument:
amplxe: Executing actions 100 % done
amplxe: Error: Error 0x40000024 (Reporter error)
It does not show the list of functions.
Thanks
- Mark as New
- Bookmark
- Subscribe
- Mute
- Subscribe to RSS Feed
- Permalink
- Report Inappropriate Content
Thanks Maria, looks like nothing was collected for some reason.
Can you please provide output of:
$ ls -al <path_to_result>/data.0
$ ls -al <path_to_result>/config
?
I suppose result directory is small, can you send it to me via private message?
- Mark as New
- Bookmark
- Subscribe
- Mute
- Subscribe to RSS Feed
- Permalink
- Report Inappropriate Content
@Vitaly Slobodskoy. I have tried to send you the private message but i guess i do not have the privilege. I have attached the output of the requested commands with this message. If you need more information, please let me know. Thanks
- Mark as New
- Bookmark
- Subscribe
- Mute
- Subscribe to RSS Feed
- Permalink
- Report Inappropriate Content
Thanks Maria!
Based on the output file you attached there is no PMU events trace in your result which leads to absence of hotspots. Can you please share exact command line you used to collect this result? Also, weren't there any error messages when you run collection? Can you run collection again and provide the output of amplxe-cl ?
- Mark as New
- Bookmark
- Subscribe
- Mute
- Subscribe to RSS Feed
- Permalink
- Report Inappropriate Content
Small addition: if you used GUI to collect result, please attach file <result_dir>/config/runsa.options or simply provide its content (it should be small). You can remove any sensitive information in its content (e.g. application name).
- Mark as New
- Bookmark
- Subscribe
- Mute
- Subscribe to RSS Feed
- Permalink
- Report Inappropriate Content
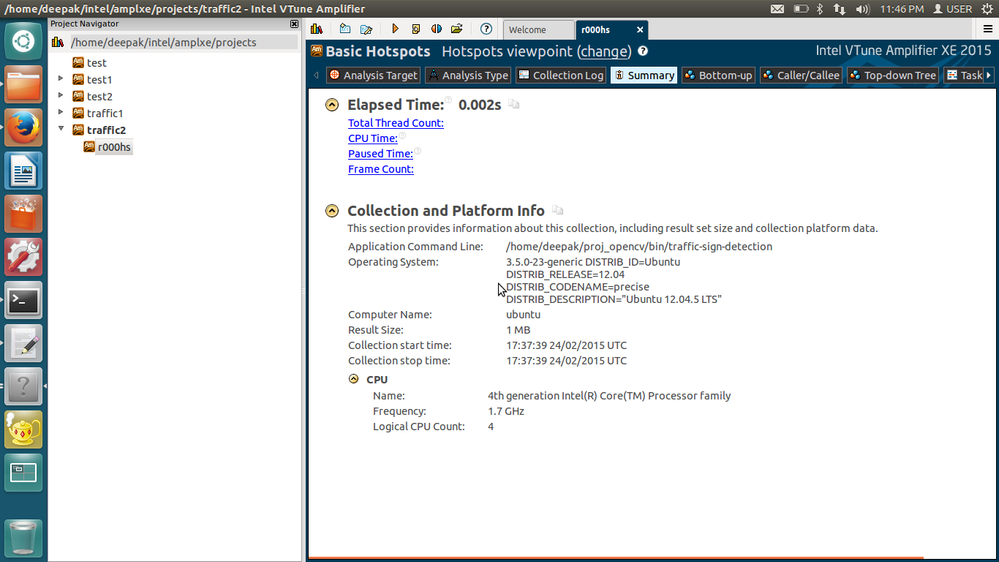
Hello,
I am also getting nearly similar problem.I am running the a C++ binary file as input on intel vtune for hotspot analysis. The application running correctly however the hotspot analysis on intel vtune GUI just provides the following summary information:
No bottom-up analysis is created that shows the modules and the functions for hotspot.
Can you please explain, why I am not getting hotspot information?
Thanks in advance.
- Mark as New
- Bookmark
- Subscribe
- Mute
- Subscribe to RSS Feed
- Permalink
- Report Inappropriate Content
So what happens when you click on the "Bottom-up" tab?
- Mark as New
- Bookmark
- Subscribe
- Mute
- Subscribe to RSS Feed
- Permalink
- Report Inappropriate Content
Never mind. Dude! You are collecting data for .002 seconds. That is way too short!!! Try profiling something of substance!! ;)
We include several samples in the product installation for this purpose. Please see <install-dir>/samples/en.
- Mark as New
- Bookmark
- Subscribe
- Mute
- Subscribe to RSS Feed
- Permalink
- Report Inappropriate Content
That is an equivalent of probably two samples way to small for gathering any profiling results.
- Subscribe to RSS Feed
- Mark Topic as New
- Mark Topic as Read
- Float this Topic for Current User
- Bookmark
- Subscribe
- Printer Friendly Page
