- Mark as New
- Bookmark
- Subscribe
- Mute
- Subscribe to RSS Feed
- Permalink
- Report Inappropriate Content
Hi,
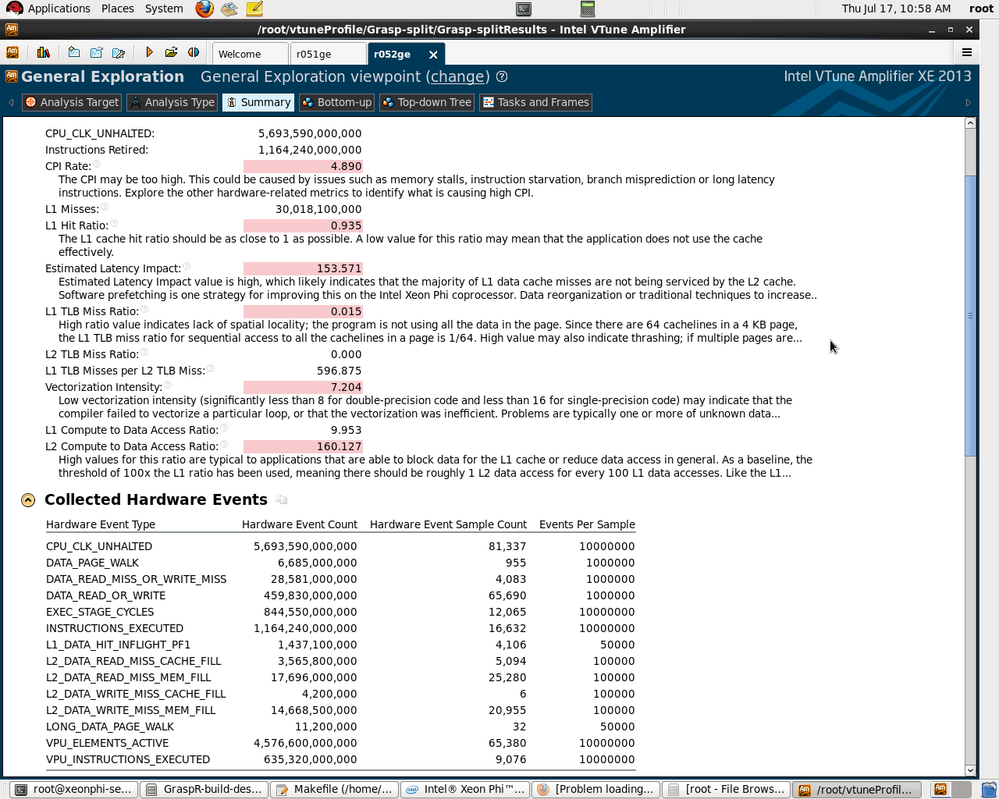
I have profiled my application using vtune amplifier XE 2013. I want to find bandwidth of my application. It is given in this link (https://software.intel.com/en-us/articles/optimization-and-performance-tuning-for-intel-xeon-phi-coprocessors-part-2-understanding) that we can compute bandwidth using these formulas.
1.Read bandwidth (bytes/clock)=(L2_DATA_READ_MISS_MEM_FILL + L2_DATA_MISS_MEM_FILL + HWP_L2MISS) * 64 / CPU_CLK_UNHALTED
2.Write bandwidth= (bytes/clock)(L2_VICTIM_REQ_WITH_DATA + SNP_HITM_L2) * 64 / CPU_CLK_UNHALTED
3.TotalBandwith (GB/Sec)=(Read bandwidth + Write bandwidth) * freq (in GHZ).
How to know HWP_L2MISS, L2_VICTIM_REQ_WITH_DATA, SNP_HITM_L2 values. I was unable to find them in summary.
Please tell how to find these values
Thanks
sivaramakrishna
Link Copied
- Mark as New
- Bookmark
- Subscribe
- Mute
- Subscribe to RSS Feed
- Permalink
- Report Inappropriate Content
These events, I mean HWP_L2MISS, L2_VICTIM_REQ_WITH_DATA, SNP_HITM_L2 values are not frequent use or say they are "counting" events, not sampling events. So they are not displayed in summary report.
Actually they are in predefined "bandwidth" analysis, but they are invisible in reports, the reason is that the tool can count events, but cannot capture (locates) "samples" in code.
You can reference these events in two ways:
1. Copy any EBS analysis to Custom Analysis, edit it then add/remove events, your will find these events in event-list.
2. A complete event-list (including HWP_L2MISS, L2_VICTIM_REQ_WITH_DATA, SNP_HITM_L2 values) can be found in vtune_amplifier/conifg/sampling3/knc_db.txt
- Mark as New
- Bookmark
- Subscribe
- Mute
- Subscribe to RSS Feed
- Permalink
- Report Inappropriate Content
Hello Sivaramakrishna,
To measure bandwidth you can use Knights Corner Platform Analysis/Bandwidth analysis type in GUI or "knc-bandwidth" analysis type in CL.
It uses uncore events to measure read and write bandwidth and shows this overtime.
If by some reason it is not enough and you want to collect the events from the document you need to do this through custom collection.
GUI:

Or CL through: -collect-with runsa-knc -knob event-config=<event_set>.
- Mark as New
- Bookmark
- Subscribe
- Mute
- Subscribe to RSS Feed
- Permalink
- Report Inappropriate Content
The "knc-bandwidth" option to VTune works fine for me, once the limitations are understood.
Memory traffic is measured at the memory controllers, which means that these measurements cannot be used for sampling and cannot be linked to particular bits of source code. So all you are going to get is the average bandwidth over some period of time.
With the command-line version of VTune, the "knc-bandwidth" option generates both a whole-program average bandwidth number and a report of the total number of cache line reads and writes for each of the two channels of each of the eight memory controllers (on Xeon Phi SE10P).
When I run this test on the STREAM benchmark, the average bandwidth number seems low -- but that is because it is including the startup time for the execution, which includes some scalar code and some relatively slow kernel code that sets up all the virtual to physical page mappings, and it includes the time spent verifying the results at the end of the benchmark (which only uses one thread). Increasing the run time of the benchmark reduces the impact of these overheads and causes the reported average bandwidth value to slowly converge to the expected results. Once the run time gets to a minute or so, the differences are small.
The number of cache line reads and writes reported is about 1% higher than the traffic explicitly requested by the benchmark. For writes this is probably due to extra stores in the page instantiation, while for reads this is probably a combination of reads during page instantiation and reads associated with TLB walks. This level of agreement is excellent, and more than accurate enough to use for performance tuning and analysis.
Note that these memory controller counts do not include the extra memory reads required to load and store the error-correction bits in DRAM. This is good news and bad news -- it means that the results are less confusing, but it also means that the results cannot be used to understand how much overhead is incurred in loading and storing these error-correction bits.
These counts do not show any read traffic for non-temporal stores. Intel's documentation on the implementation of non-temporal stores on Xeon Phi is a bit confusing -- some places say that with nontemporal stores the cache lines are not allocated into the L1 cache, which (sort of) implies that they *are* allocated into the L2 cache. If so, the memory controller counters exclude those reads. (This is easy enough to do if they are of a different transaction type.)
- Mark as New
- Bookmark
- Subscribe
- Mute
- Subscribe to RSS Feed
- Permalink
- Report Inappropriate Content
Thank you Peter Wang, dmitry-prohorov, John D. McCalpin for your inputs.
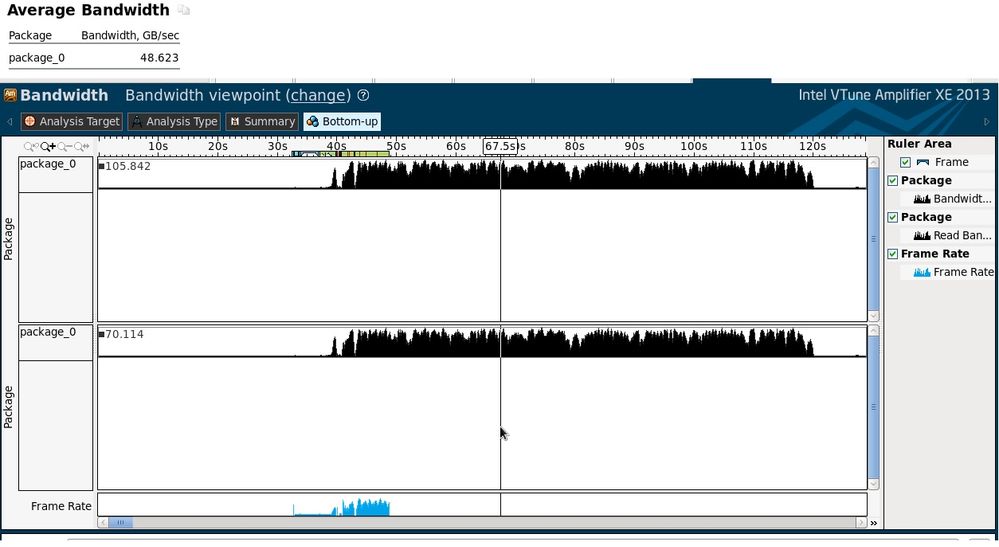
I have checked bandwidth analysis of my program. The snapshot of it is below.
The average bandwidth in the summary shows around 48GB/sec. Where as in bottom up it is showing bandwidth = 105 GB/sec and read bandwidth = 70 GB/sec. I am a bit confused about these bandwidth values here. what do they mean? Is this 105GB is the peak value of the bandwidth in the time line from 40 sec to 120 sec? It is given in the optimizations and performance tuning article, we have to investigate if memory bandwidth is < 80 GB/sec. Does setting of MIC_USE_2MB_BUFFERS=64K helps?. What are the possibile optimizations to increase bandwidth. I would be glad if you can give me any insights on this.
Thanks
sivaramakrishna
- Mark as New
- Bookmark
- Subscribe
- Mute
- Subscribe to RSS Feed
- Permalink
- Report Inappropriate Content
I don't use the VTune GUI, but the only interpretation that makes sense to me is that the number on the left is the maximum value observed during the interval (and therefore also the scaling value for the plot). Here you can see that the reported average value of 48.6 GB/s is strongly biased downward by the long startup period with essentially zero bandwidth. Assuming 0 GB/s for 40 seconds and "x" GB/s for 80 seconds requires that the average bandwidth during the 80 seconds be 72.9 GB/s to get an average of 48.3 GB/s. This seems consistent with the average value that one would estimate from looking at the upper plot and assuming that the maximum value is at 105.842 GB/s.
The results above imply a read:write ratio of almost exactly 2:1. This is a fairly write-heavy workload, as these things go -- at the edge of the typical range of high-bandwidth workloads, but not outside it.
Possible optimizations for high-bandwidth codes:
- If the writes are to data that will not be re-used before getting evicted from the cache (e.g., as in the four kernels of the STREAM benchmark), then encouraging the compiler to generate non-temporal stores may provide a useful boost. You can check to see if these are already being generated by compiling to an assembly listing and looking for the "vmovnrngoaps" instruction. (The compiler seems to prefer to generate the "vmovnrngoaps" instruction instead of the "vmovnrngoapd" instruction even for double-precision values. I think this is because the data type does not matter if you are storing all 512 bits of the result and the single-precision version of the instruction requires fewer prefix bytes than the double-precision version of the instruction.) It is usually best to control non-temporal stores at the loop level with a pragma that names the specific array for which you want the streaming stores -- forcing all stores to be nontemporal usually degrades performance.
- The STREAM benchmark shows a fairly strong dependence on how far ahead the software prefetches are pointed. An example is the "-opt-prefetch-distance=64,8" compiler option used in the STREAM benchmark. The first argument is how many cache lines ahead to point the L2 prefetches and the second argument is how many cache lines ahead to point the L1 prefetches. This option gives a 25% boost to STREAM Triad performance, but the specific numbers will depend on the details of the code.
- Generally speaking, prefetch further ahead if only a few arrays are being accessed in the main loops and prefetch closer if more arrays are being used in the main loop -- but you will have to experiment to find the best values.
- Note that large L2 prefetch distances are only useful if the code is using large pages (2 MiB pages, aka "hugetlbpages"). Large pages are generated by default if the "transparent huge page" feature is enabled on your system and you make an allocation that is much larger than 2 MiB. I recommend using a memory allocator that allows you to specify alignment so that you can start on a 2MiB boundary (e.g., posix_memalign()).
- The compiler will sometimes generate cache eviction instructions for data that it thinks it does not need any more. This can free up cache for other variables and can help reduce contention on L2 writebacks. Compiler placement is not always optimal, so experimenting with the -opt-streaming-cache-evict compiler flag can help. Setting this to zero provides an additional 10% boost on the STREAM Triad benchmark.
- Perhaps surprisingly, alignment does not make a lot of difference for high-bandwidth codes. It makes a big difference for L1-contained codes, where loading each cache line twice is a big problem, but if data is coming from memory there are plenty of otherwise idle cycles to perform these extra loads.
- On the other hand, avoiding (potential) aliasing is critical for high-bandwidth codes. Not only does potential aliasing prevent vectorization, it also forces the compiler to reload data after every memory store, since it cannot prove that a store to one pointer does not change the values pointed to by another pointer. The compiler -vec-report6 option will list the loops that are not vectorized along with the reasons. Look for the phrase "vector dependence" to see where the compiler may be having trouble with not being able to prove an absence of aliasing.
- Mark as New
- Bookmark
- Subscribe
- Mute
- Subscribe to RSS Feed
- Permalink
- Report Inappropriate Content
- Subscribe to RSS Feed
- Mark Topic as New
- Mark Topic as Read
- Float this Topic for Current User
- Bookmark
- Subscribe
- Printer Friendly Page

