- Mark as New
- Bookmark
- Subscribe
- Mute
- Subscribe to RSS Feed
- Permalink
- Report Inappropriate Content
Hi, I have downloaded VTune Profiler (free version) and installed it on my Linux server.
I would like to create a custom analysis to collect the events of L1/L2/L3 hits and misses.
However, I did not find a way to do this in the VTune GUI.
Could you please help me?
Thanks.
1 Solution
- Mark as New
- Bookmark
- Subscribe
- Mute
- Subscribe to RSS Feed
- Permalink
- Report Inappropriate Content
Hi,
I see 2 options here.
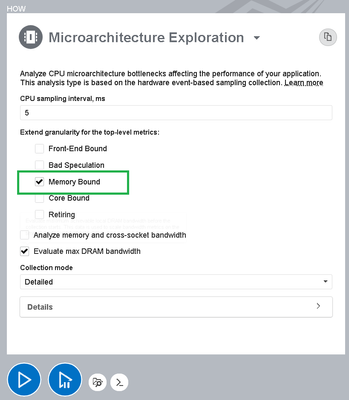
you could chose MA analysis and just stay memory bound
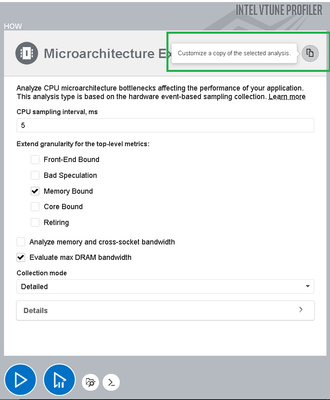
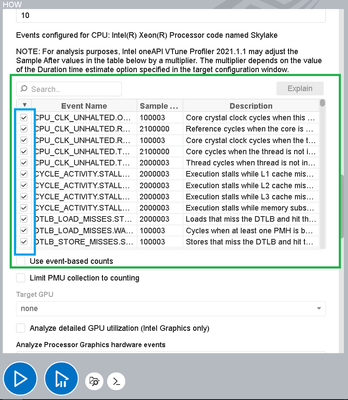
or create custom analysis and choose events which you need.
Thanks, Kirill
Link Copied
2 Replies
- Mark as New
- Bookmark
- Subscribe
- Mute
- Subscribe to RSS Feed
- Permalink
- Report Inappropriate Content
Hi,
I see 2 options here.
you could chose MA analysis and just stay memory bound
or create custom analysis and choose events which you need.
Thanks, Kirill
- Mark as New
- Bookmark
- Subscribe
- Mute
- Subscribe to RSS Feed
- Permalink
- Report Inappropriate Content
Hi,
Glad to know your query has been resolved. We would no longer be monitoring this thread. Please raise a new thread for further issues.
Regards
Gopika
Reply
Topic Options
- Subscribe to RSS Feed
- Mark Topic as New
- Mark Topic as Read
- Float this Topic for Current User
- Bookmark
- Subscribe
- Printer Friendly Page


