- Mark as New
- Bookmark
- Subscribe
- Mute
- Subscribe to RSS Feed
- Permalink
- Report Inappropriate Content
Hello,
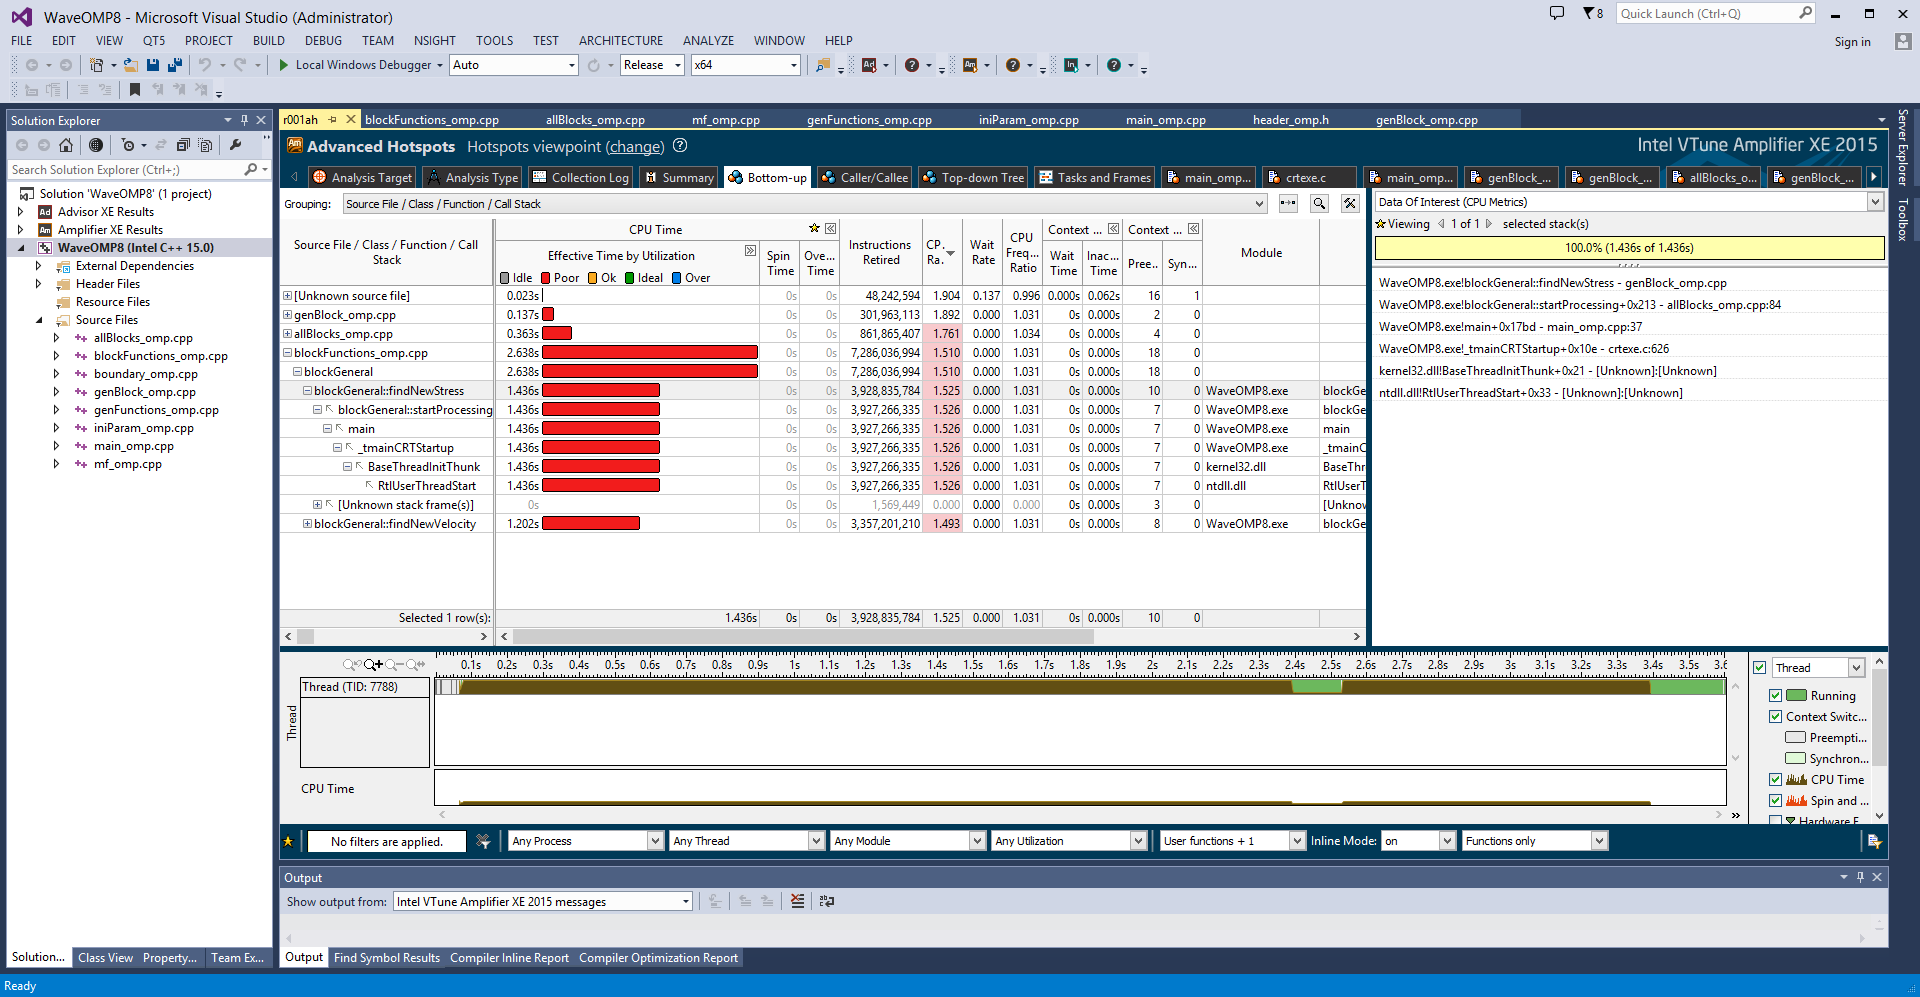
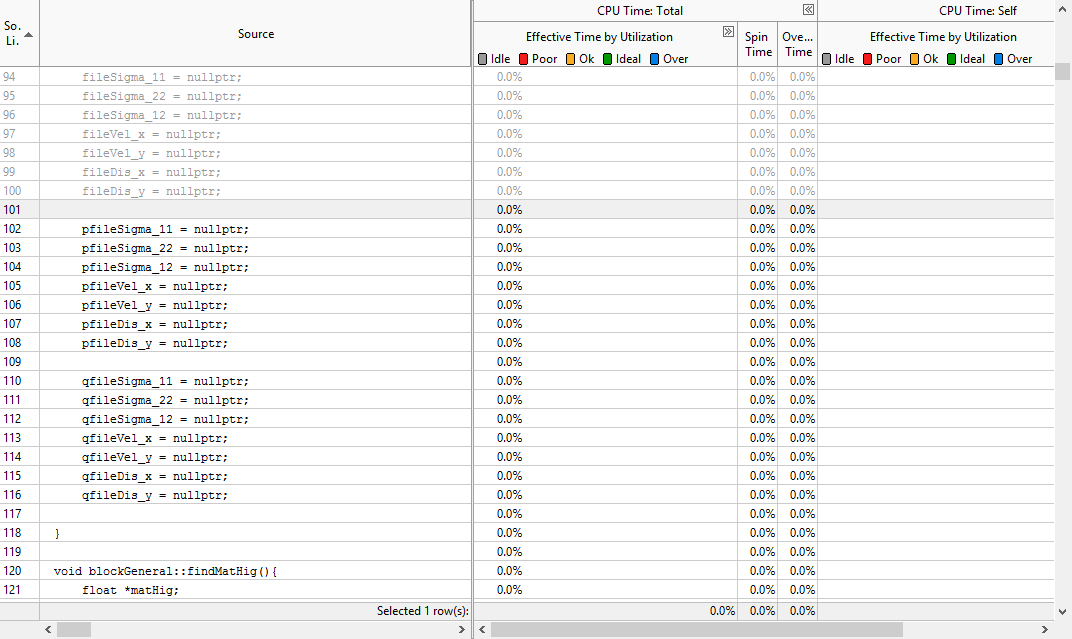
I use Windows 8.1, Visual Studio 2012 and 2013, Intel Parallel Studio XE 2015, Intel VTune Amplifier XE 2015. I created a c/c++ project, want to see assembly code for Release. I use Advanced Hotspots and would like to see source/assembly code for some of my functions. However when I double click on a function I need to access I either go to a place where this function is called from (4.png) or to a place which is not related to this function (3.png). However I expect to see code as in 2.png + information provided by amplifier.
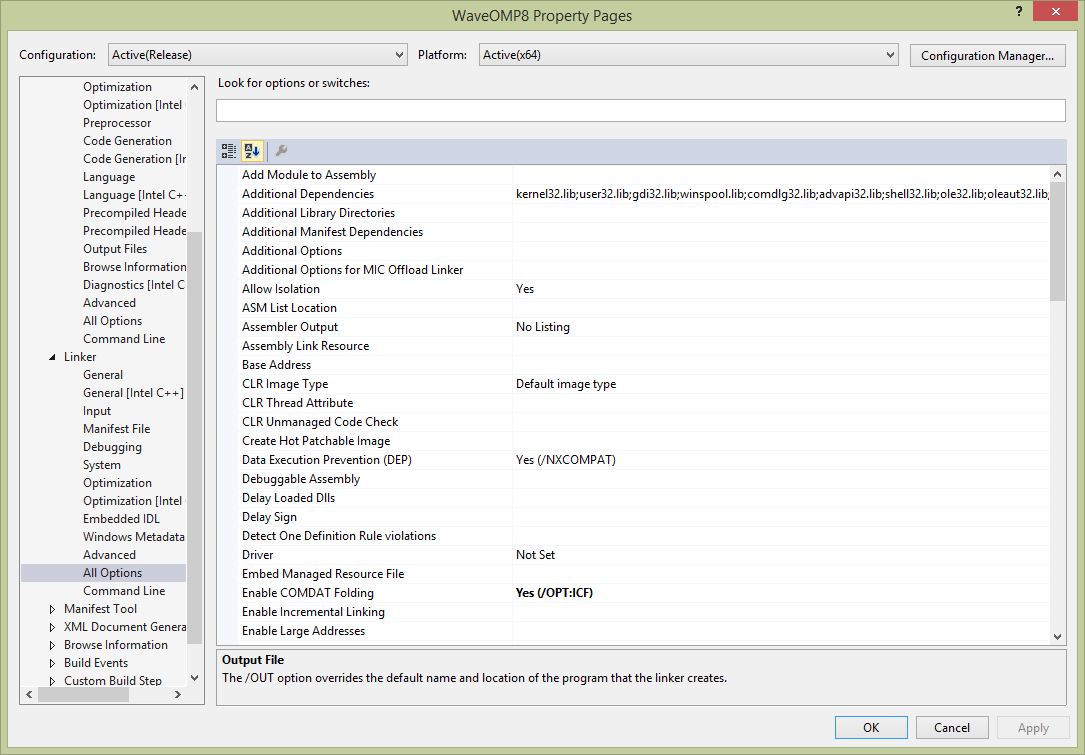
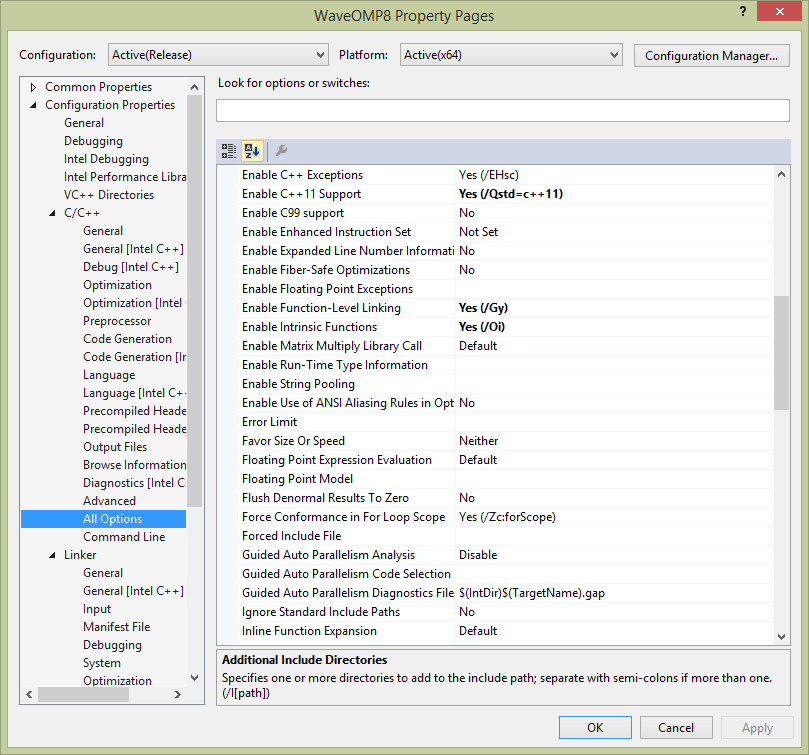
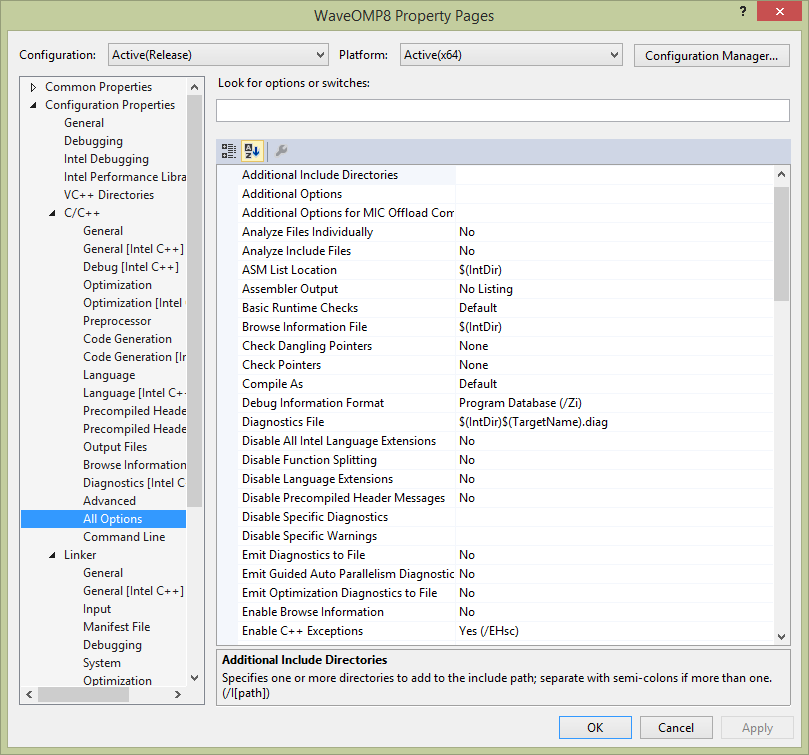
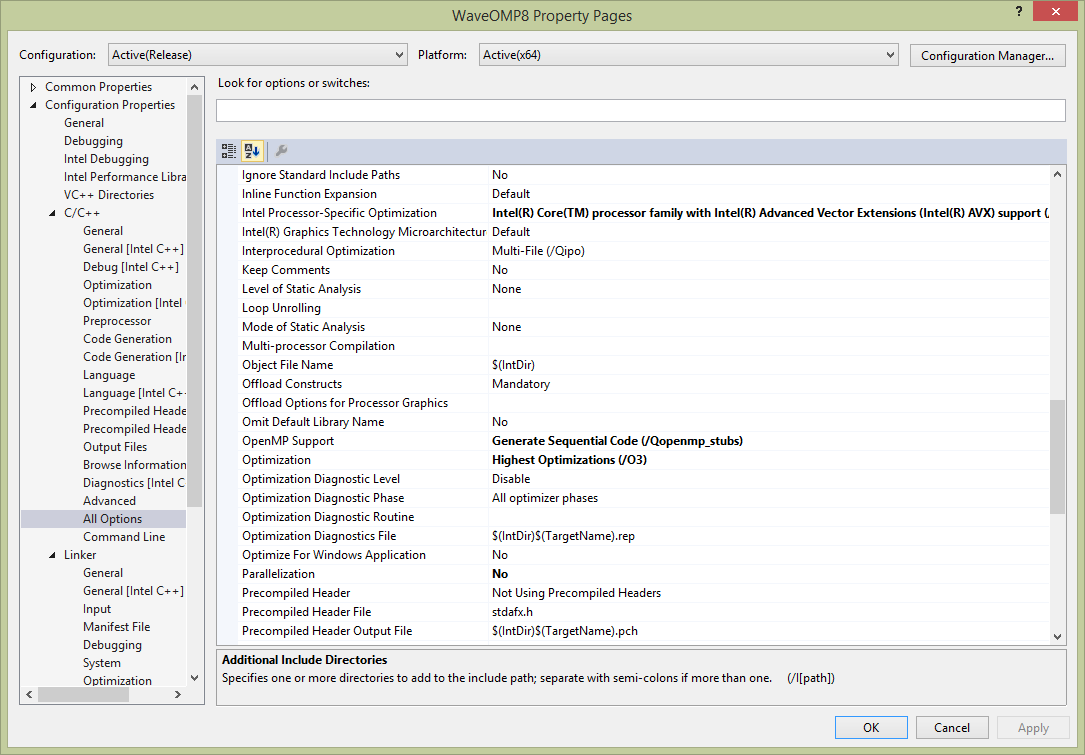
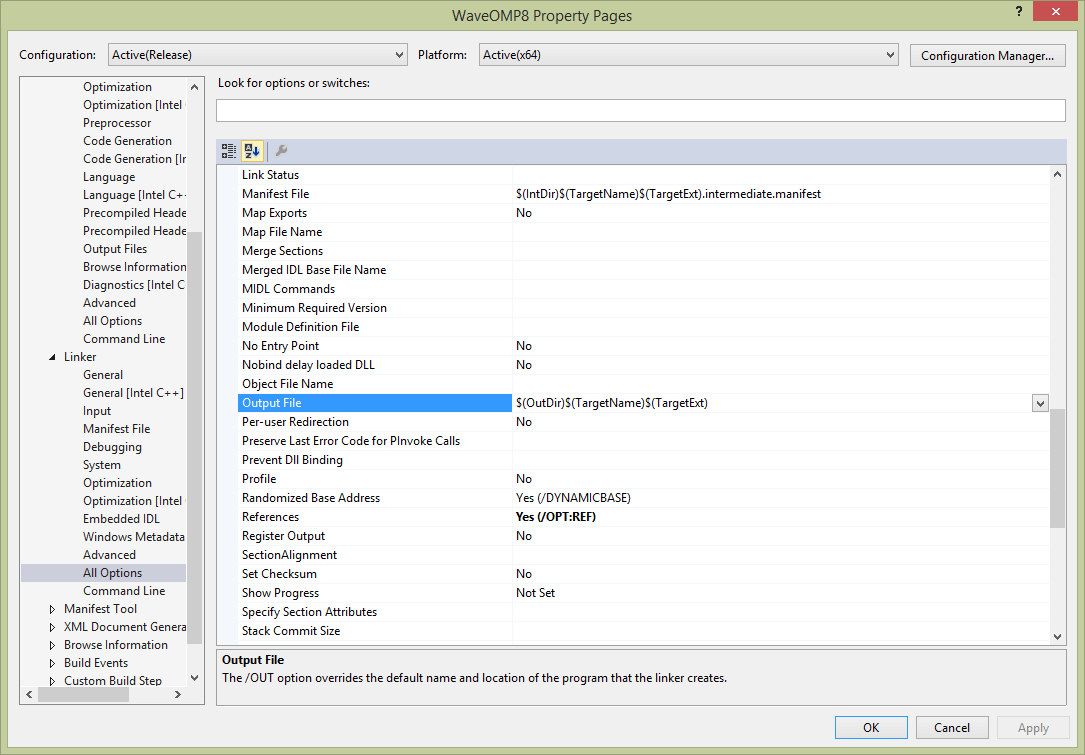
Debug/Liner settings can be found in the other png files.
I am not sure but when I used Intel C++ 13.0 there were not such problems.
I guess there should be some settings either for the compiler or Amplifier I need to adjust in order to see the code in VTune Amplifier.
Options related OpenMP/Intel Processor-specific Optimization do not change the behaviour.
Kind regards,
Sofya
Link Copied
- Mark as New
- Bookmark
- Subscribe
- Mute
- Subscribe to RSS Feed
- Permalink
- Report Inappropriate Content
Did you imply there was no problem, if you used same options to build by using Intel C++ compiler 13.0? But you found there was problem if you built with Intel compiler 15.0 Or use VS2013 or use VS2015?
1. It seemed that compiler option "/Zi" used, and .pdb file is generated.
2. If .pdb file was stored in other placed, not same directory of .exe file, need to add search path. If there was a dialog to be popped up for setting the path...ignore this.
3. Just use option "/Od" to disable optimization to verify problem,again. If it works, it could be optimization issue - for example, inline function is not supported, you need to use option "/debug:inline-debug-info", so VTune can view source of such function.
4. What is situation when you use Debug Mode? Same problem? Can you use debugger to stop break point at expected function?
5. If you cannot solve the problem after doing above, can you provide VTune advanced-hotspots result with binary/pdb files to me via private message? Thank you. ("FindNewStress()" is expected function, am I right?)
- Mark as New
- Bookmark
- Subscribe
- Mute
- Subscribe to RSS Feed
- Permalink
- Report Inappropriate Content
Dear Peter,
Thank you for your advice.
I use option "/debug:inline-debug-info" and then it works. However, I have to add this option manually in "Additional Options" in Configuration Properties -> C/C++ -> Command Line", since I have not found it. Do you know if this option can be chosen from existing options in Visual Studio?
On the other hand if I use "C/C++ -> Optimization -> Inline Function Expansion -> Only __inline (/Ob1)" I get almost similar results.
Kind regards,
Sofya
- Mark as New
- Bookmark
- Subscribe
- Mute
- Subscribe to RSS Feed
- Permalink
- Report Inappropriate Content
Hi Sofya,
I'm glad that it works after using "debug:inline-debug-info". Another option "/Ob1" also can work, but your function is not optimized to "inline" function, because your function is not declared "inline". So, option "debug:inline-debug-info" is recommended to be used with optimization option.
Not all Intel compiler's options will be appeared on GUI, you can put them in "Command Line". However, you can raise this request to Intel(R) C++ Composer product.
Thanks, Peter
- Subscribe to RSS Feed
- Mark Topic as New
- Mark Topic as Read
- Float this Topic for Current User
- Bookmark
- Subscribe
- Printer Friendly Page