I am trying to put at work (for the first time) VTune Amplifier XE 2016 on a Linux C++ code.
I am facing with the following issue:
I have a class with methods ‘detectElements’ and ‘detectAxisElements’.
‘detectElements’ is calling ‘detectAxisElements’ twice with different parameters (there is no other call to ‘detectAxisElements’ in my code).
Looking at VTune’s result, I can see in the Caller/Callee tab:
For “CPU Time: Total”
‘detectElements 0.1%
‘detectAxisElements’ 27.1%
For “CPU Time: Self”
‘detectElements’ 0.0%
‘detectAxisElements’ 11.1%
‘detectAxisElements’ does not seem to be recognized as being called from ‘detectElements’.
Looking at the “Callees pane” for ‘detectElements’, I can see several other methods and operators but nothing about 'detectAxisElements’.
Any hint to let me understand this point is welcome.
連結已複製
And which compiler are you using? It could be that the method is being inlined by the compiler. Try setting the 'inline-debug-info' debug flag (Intel compiler supports this and I think gcc does as well).
- detectElements is rather simple:
float depth_threshold,
float normal_threshold) {
// re-init
elements.clear();
elements_horiztal.clear();
elements_vertical.clear();
if (m_Debug)
m_buffer = Mat_<cv::Vec3b>::zeros( static_cast<int>(h), static_cast<int>(w) );
// detect elements (horizontal and vertical in parallel)
detectAxisElements(elements, depth_threshold, normal_threshold, false /* horizontal */);
detectAxisElements(elements, depth_threshold, normal_threshold, true /* vertical */);
// render the normals
if (m_Debug)
{
const Vec3b color = Vec3b(255,0,0) ;
// for(size_t i = 0 ; i < elements.size() ; i += 13)
for(size_t i = 0 ; i < elements.size() ; i++)
{
const element_t &e = elements;
const Vec2f &y = e.x + 5 * e.n;
line(m_buffer, Point2f(e.x), Point2f(y), color);
}
}
// update nbr of elements for next sampling
m_autoSamplesNbr = elements.size();
}
- I am using the "Advanced Hotspots" Algorithm Analysis (with 'CPU sampling interval' set to 0.01 [minimum value]).
With "Basic Hotspots", I got :
“CPU Time: Total”
‘detectElements' 58.4%
‘detectAxisElements’ 38.6%
And 'detectAxisElements’ is present in the detectElements' calles list.
- I am using g++ compiler.
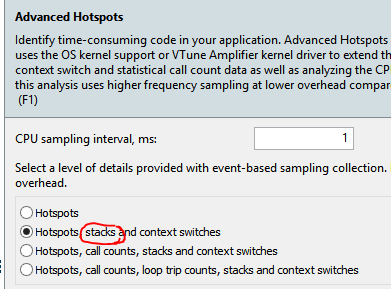
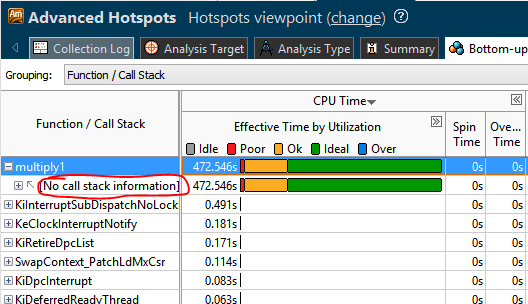
If you don't include stacks, you can't use the "Caller/Callee" tab since there is no information about who called whom.
Also, you will notice in the Bottom Up display, if you attempt to expand the function call stack, the "No call stack info" message will be displayed. To see any calling sequences, you must select one of the configurations that includes "stacks." Then, you will only see calling sequences that were executed and had samples collected during their execution.
Thanks MrAnderson,
Last weeks, I tried to select the option "Hotspots, stacks and context switches", but I got the message that because of selected "context switches", sampling driver was required and not found. And I couldn't use the "Start" button. (I have no root access and I did not have the rights for the driver installation)
Today, I got the same warning message but I was able to start the analysis and I got the expected results (calls hierarchy correctly reported).
So the initial problem seems to be solved.
Just remains the mystery of the behavioural change...
Maybe you made some remote actions... ;=) Thanks a lot!
Best regards.

