- Mark as New
- Bookmark
- Subscribe
- Mute
- Subscribe to RSS Feed
- Permalink
- Report Inappropriate Content
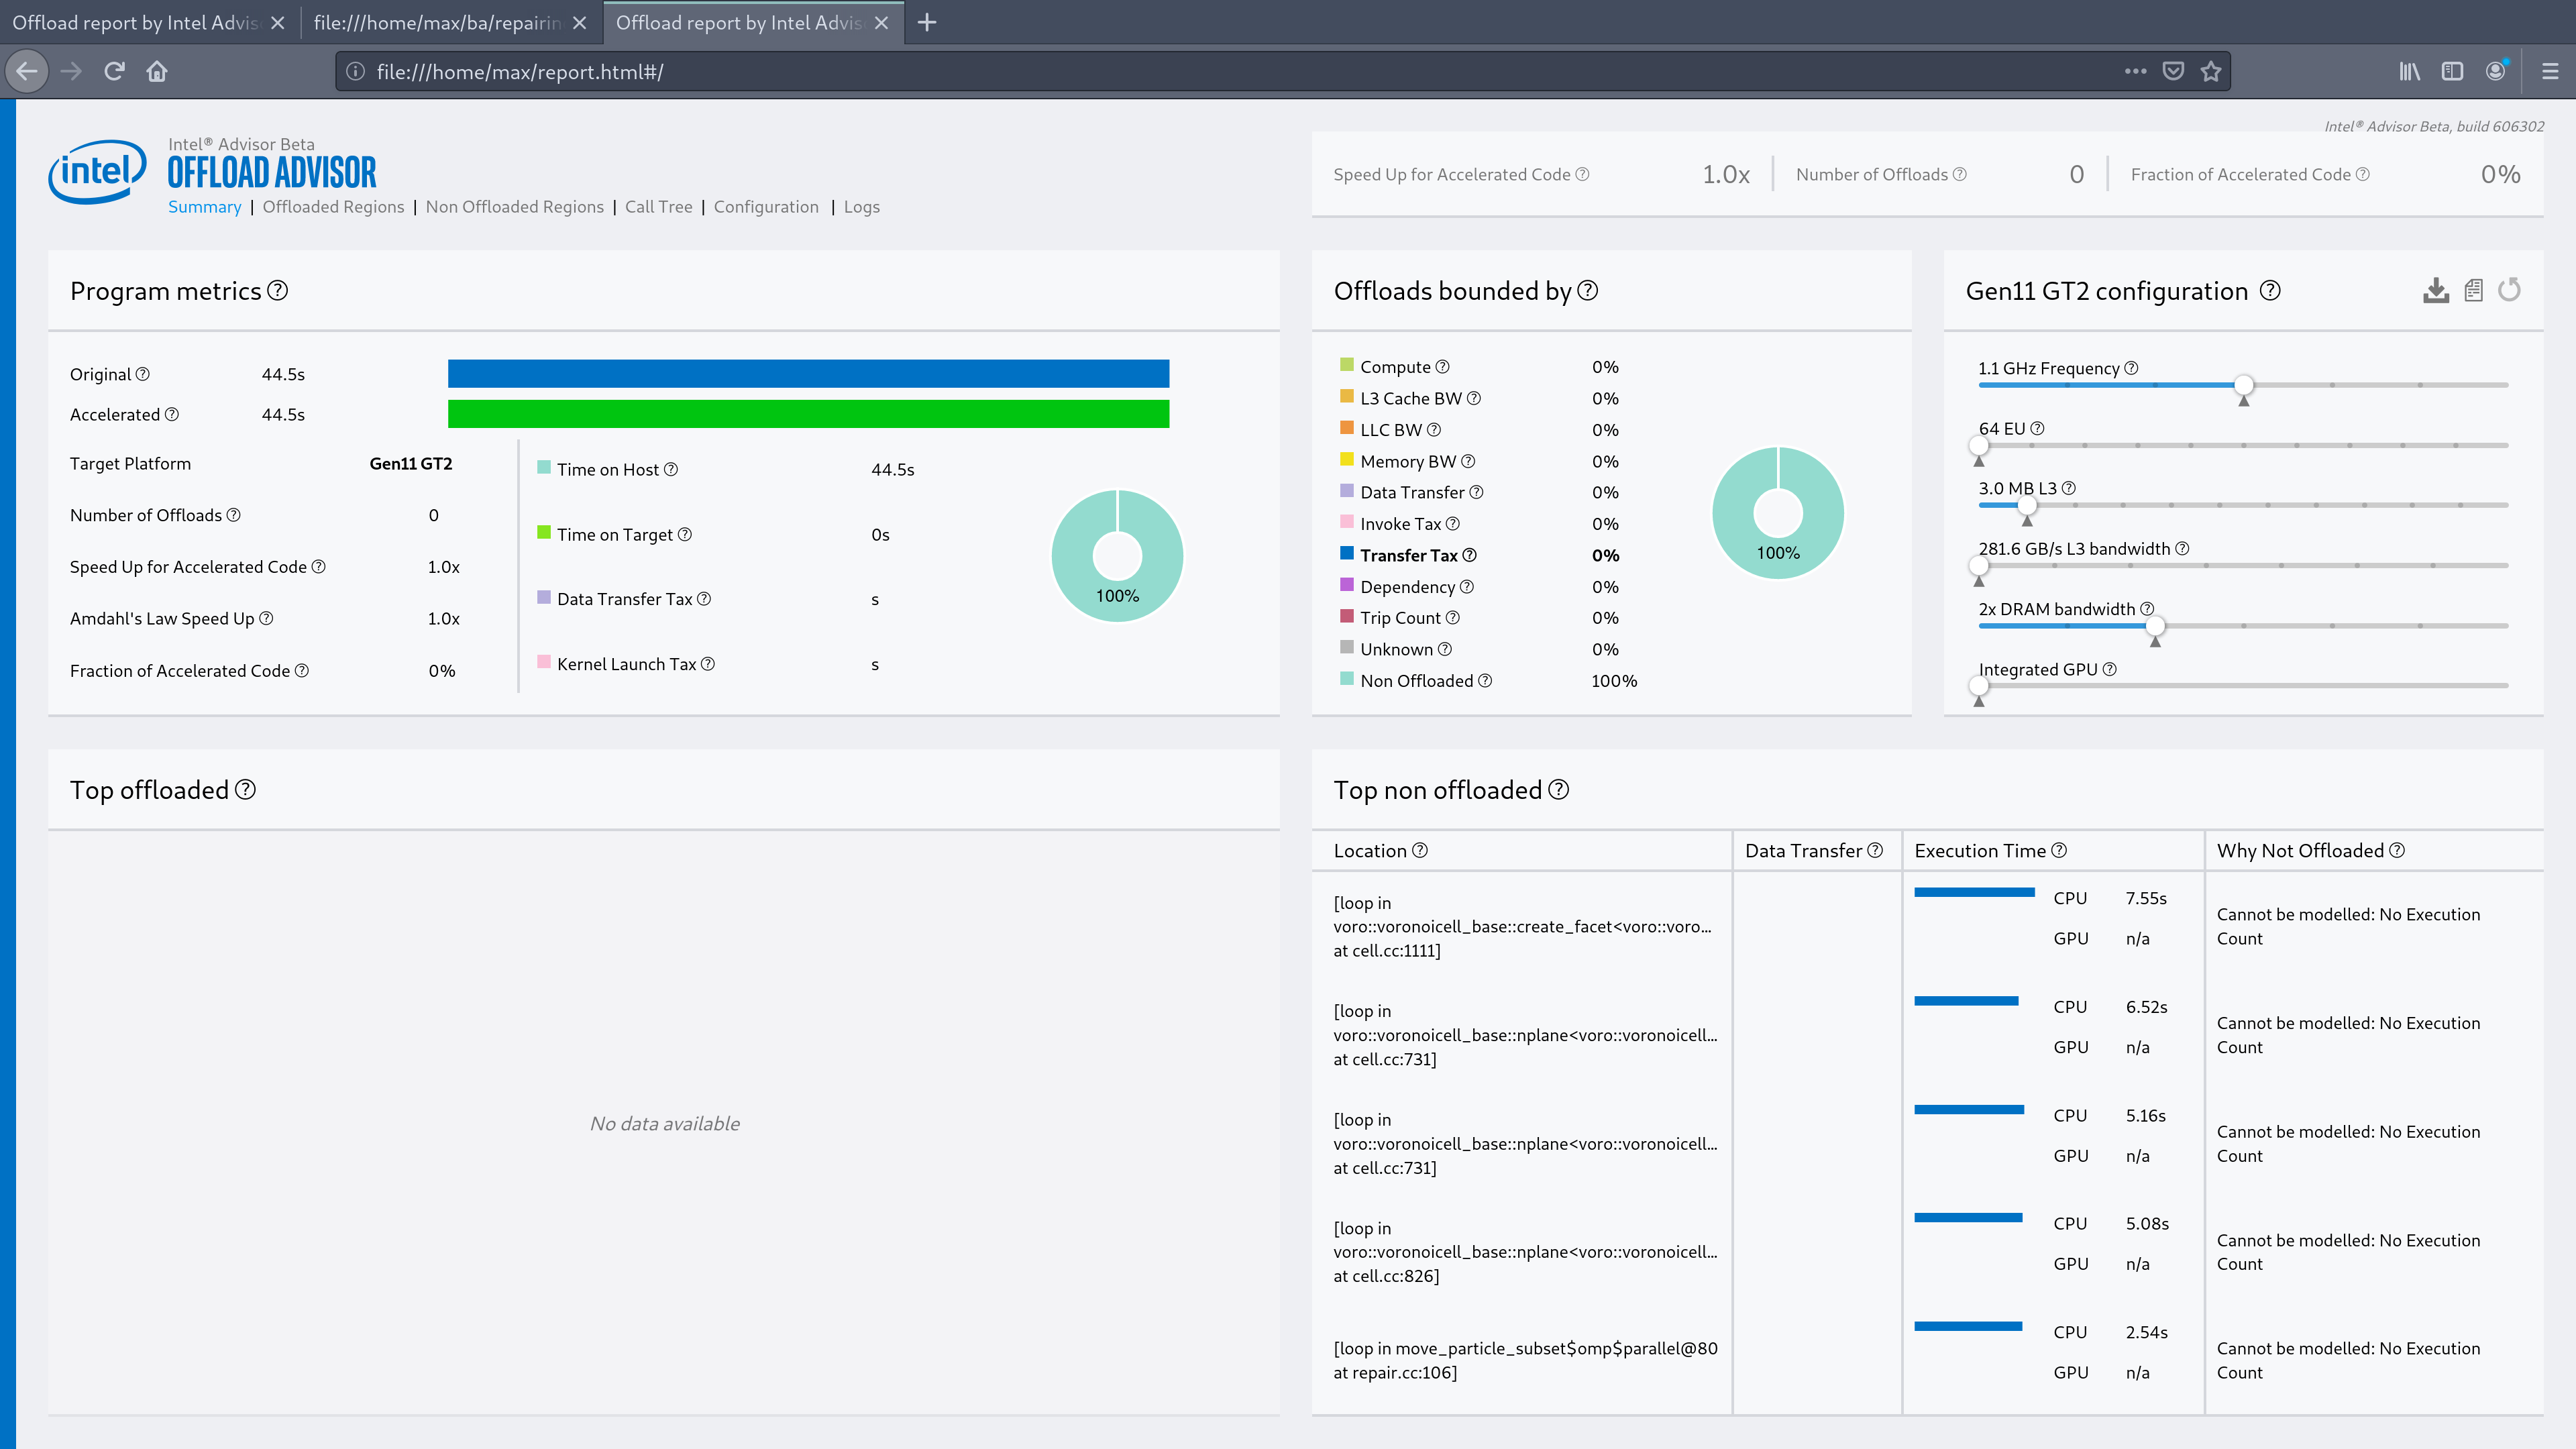
I am trying to use Intel Advisor beta to do an offloading analysis. I have the problem that all non offloaded regions show 'Cannot be modelled: No Execution Count'.
I've already tried the troubleshooting described under https://software.intel.com/content/www/us/en/develop/documentation/advisor-user-guide/top/offload-advisor/offload-advisor-troubleshooting/offload-advisor-troubleshooting-why-not-offloaded/offload-advisor-troubleshooting-cannot-be-modeled.html and https://software.intel.com/content/www/us/en/develop/documentation/advisor-user-guide/top/offload-advisor/offload-advisor-troubleshooting/offload-advisor-troubleshooting-broken-call-tree.html Moreover I tried using a programm with larger runtime.
Furthermore I get the warning
advixe: Warning: A symbol file is not found. The call stack passing through `...../programm.out' module may be incorrect.
I compiled with the compiler flags (i.e. debugging symbols are turned on):
-O2 -std=c++11 -fopenmp -g -no-ipo -debug inline-debug-info
I am using Intel(R) Advisor 2021.1 beta07 (build 606302), and Intel(R) C Intel(R) 64 Compiler for applications running on Intel(R) 64, Version 2021.1 Beta Build 202006. The programm uses OpenMP.
How can I fix this?
- Tags:
- Advisor
- Mark as New
- Bookmark
- Subscribe
- Mute
- Subscribe to RSS Feed
- Permalink
- Report Inappropriate Content
Dear @lm1909 ,
Could You please restart your experiment with additional option for collect.py "--no-track-heap-objects"? It should help, but precision will be a little bit lower.
Link Copied
- Mark as New
- Bookmark
- Subscribe
- Mute
- Subscribe to RSS Feed
- Permalink
- Report Inappropriate Content
Hi,
Moving this thread to Analyzers forum for better support.
Thanks,
Rahul
- Mark as New
- Bookmark
- Subscribe
- Mute
- Subscribe to RSS Feed
- Permalink
- Report Inappropriate Content
Hi @lm1909 ! Can you please share some more details about your application?
- Is there any region suggested to offload? If no, could you please ensure collected profile contains at least one loop with trip counts > 1?
- Which loops have "No Execution Count" diagnostics? Are they really executed? Is the time in these loops significant?
- Are you using Intel Compiler?
Can you please share report.html? This will be really helpful.
- Mark as New
- Bookmark
- Subscribe
- Mute
- Subscribe to RSS Feed
- Permalink
- Report Inappropriate Content
Hi @dpetrov! Sure:
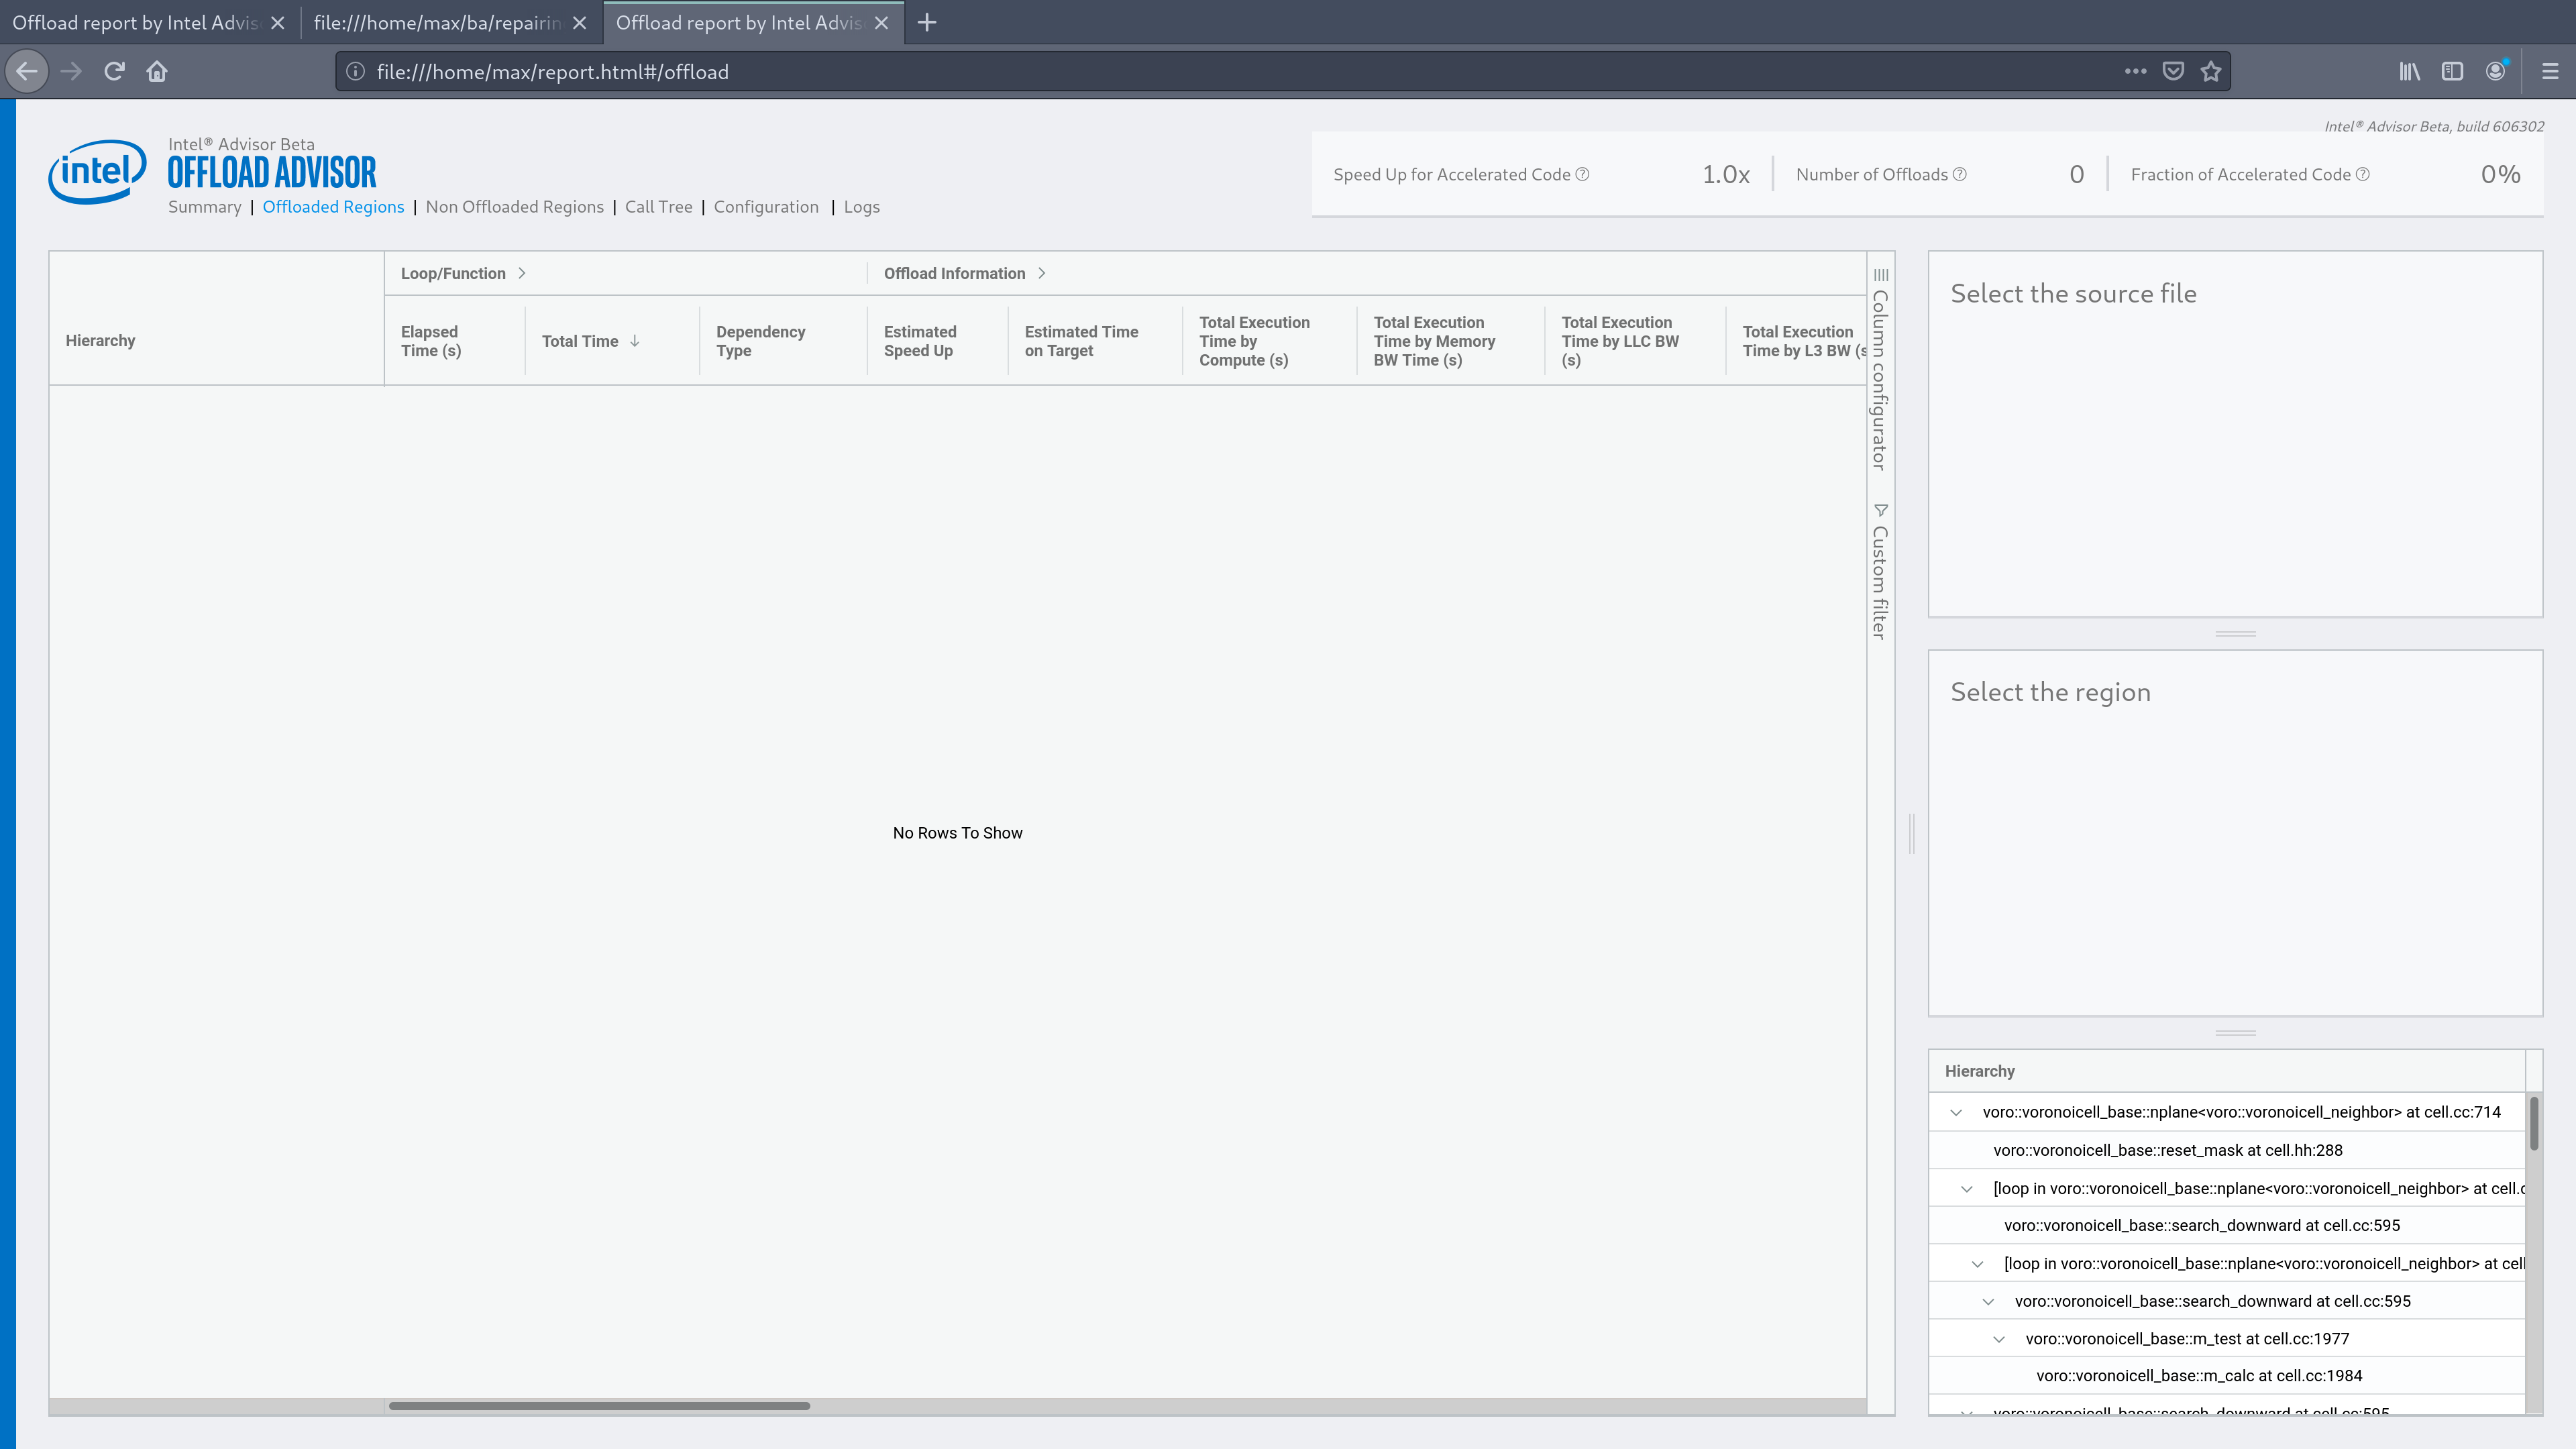
- There are no regions which are offloaded, there are no call count >1 (all show "<1")
- Nearly all of them (only some have system module), the time in the loops are multiple seconds (is that enough? running the offload analysis like this takes around 1 hour on my Laptop, more would become a bit impractical)
- Yes I am using the Intel Compiler
report.html contains part of the source code right? (I'd prefer to not post that to the internet), I've attached screenshots of all the views in the report, I hope that's ok and helps?
Thanks a lot for your help and please let me know if you need anything else!
- Mark as New
- Bookmark
- Subscribe
- Mute
- Subscribe to RSS Feed
- Permalink
- Report Inappropriate Content
@lm1909 ,
Several seconds should be enough for profiling and performance modelling.
Well, from screenshots provided I can see results of Survey and Dependencies analysis, but not Trip Counts.
How did you run collection phase of performance modelling? Did you use `collect.py`, or `run_oa.py`, or `advixe-cl`? For the last case, have you run Trip Counts analysis? Has it finished without error?
If yes, could you please share list of files in `<proj_dir>/e000/trc000`, `<proj_dir>/e000/trc000/data.0` directories? Also please ensure file `<proj_dir>/e000/trc000/data.0/advixe-runtrc.log` is valid XML with final tag `</log>`.
- Mark as New
- Bookmark
- Subscribe
- Mute
- Subscribe to RSS Feed
- Permalink
- Report Inappropriate Content
offload4.png should show the average trip count, it's always <1. (or is it something else you mean? sorry if that's the case!)
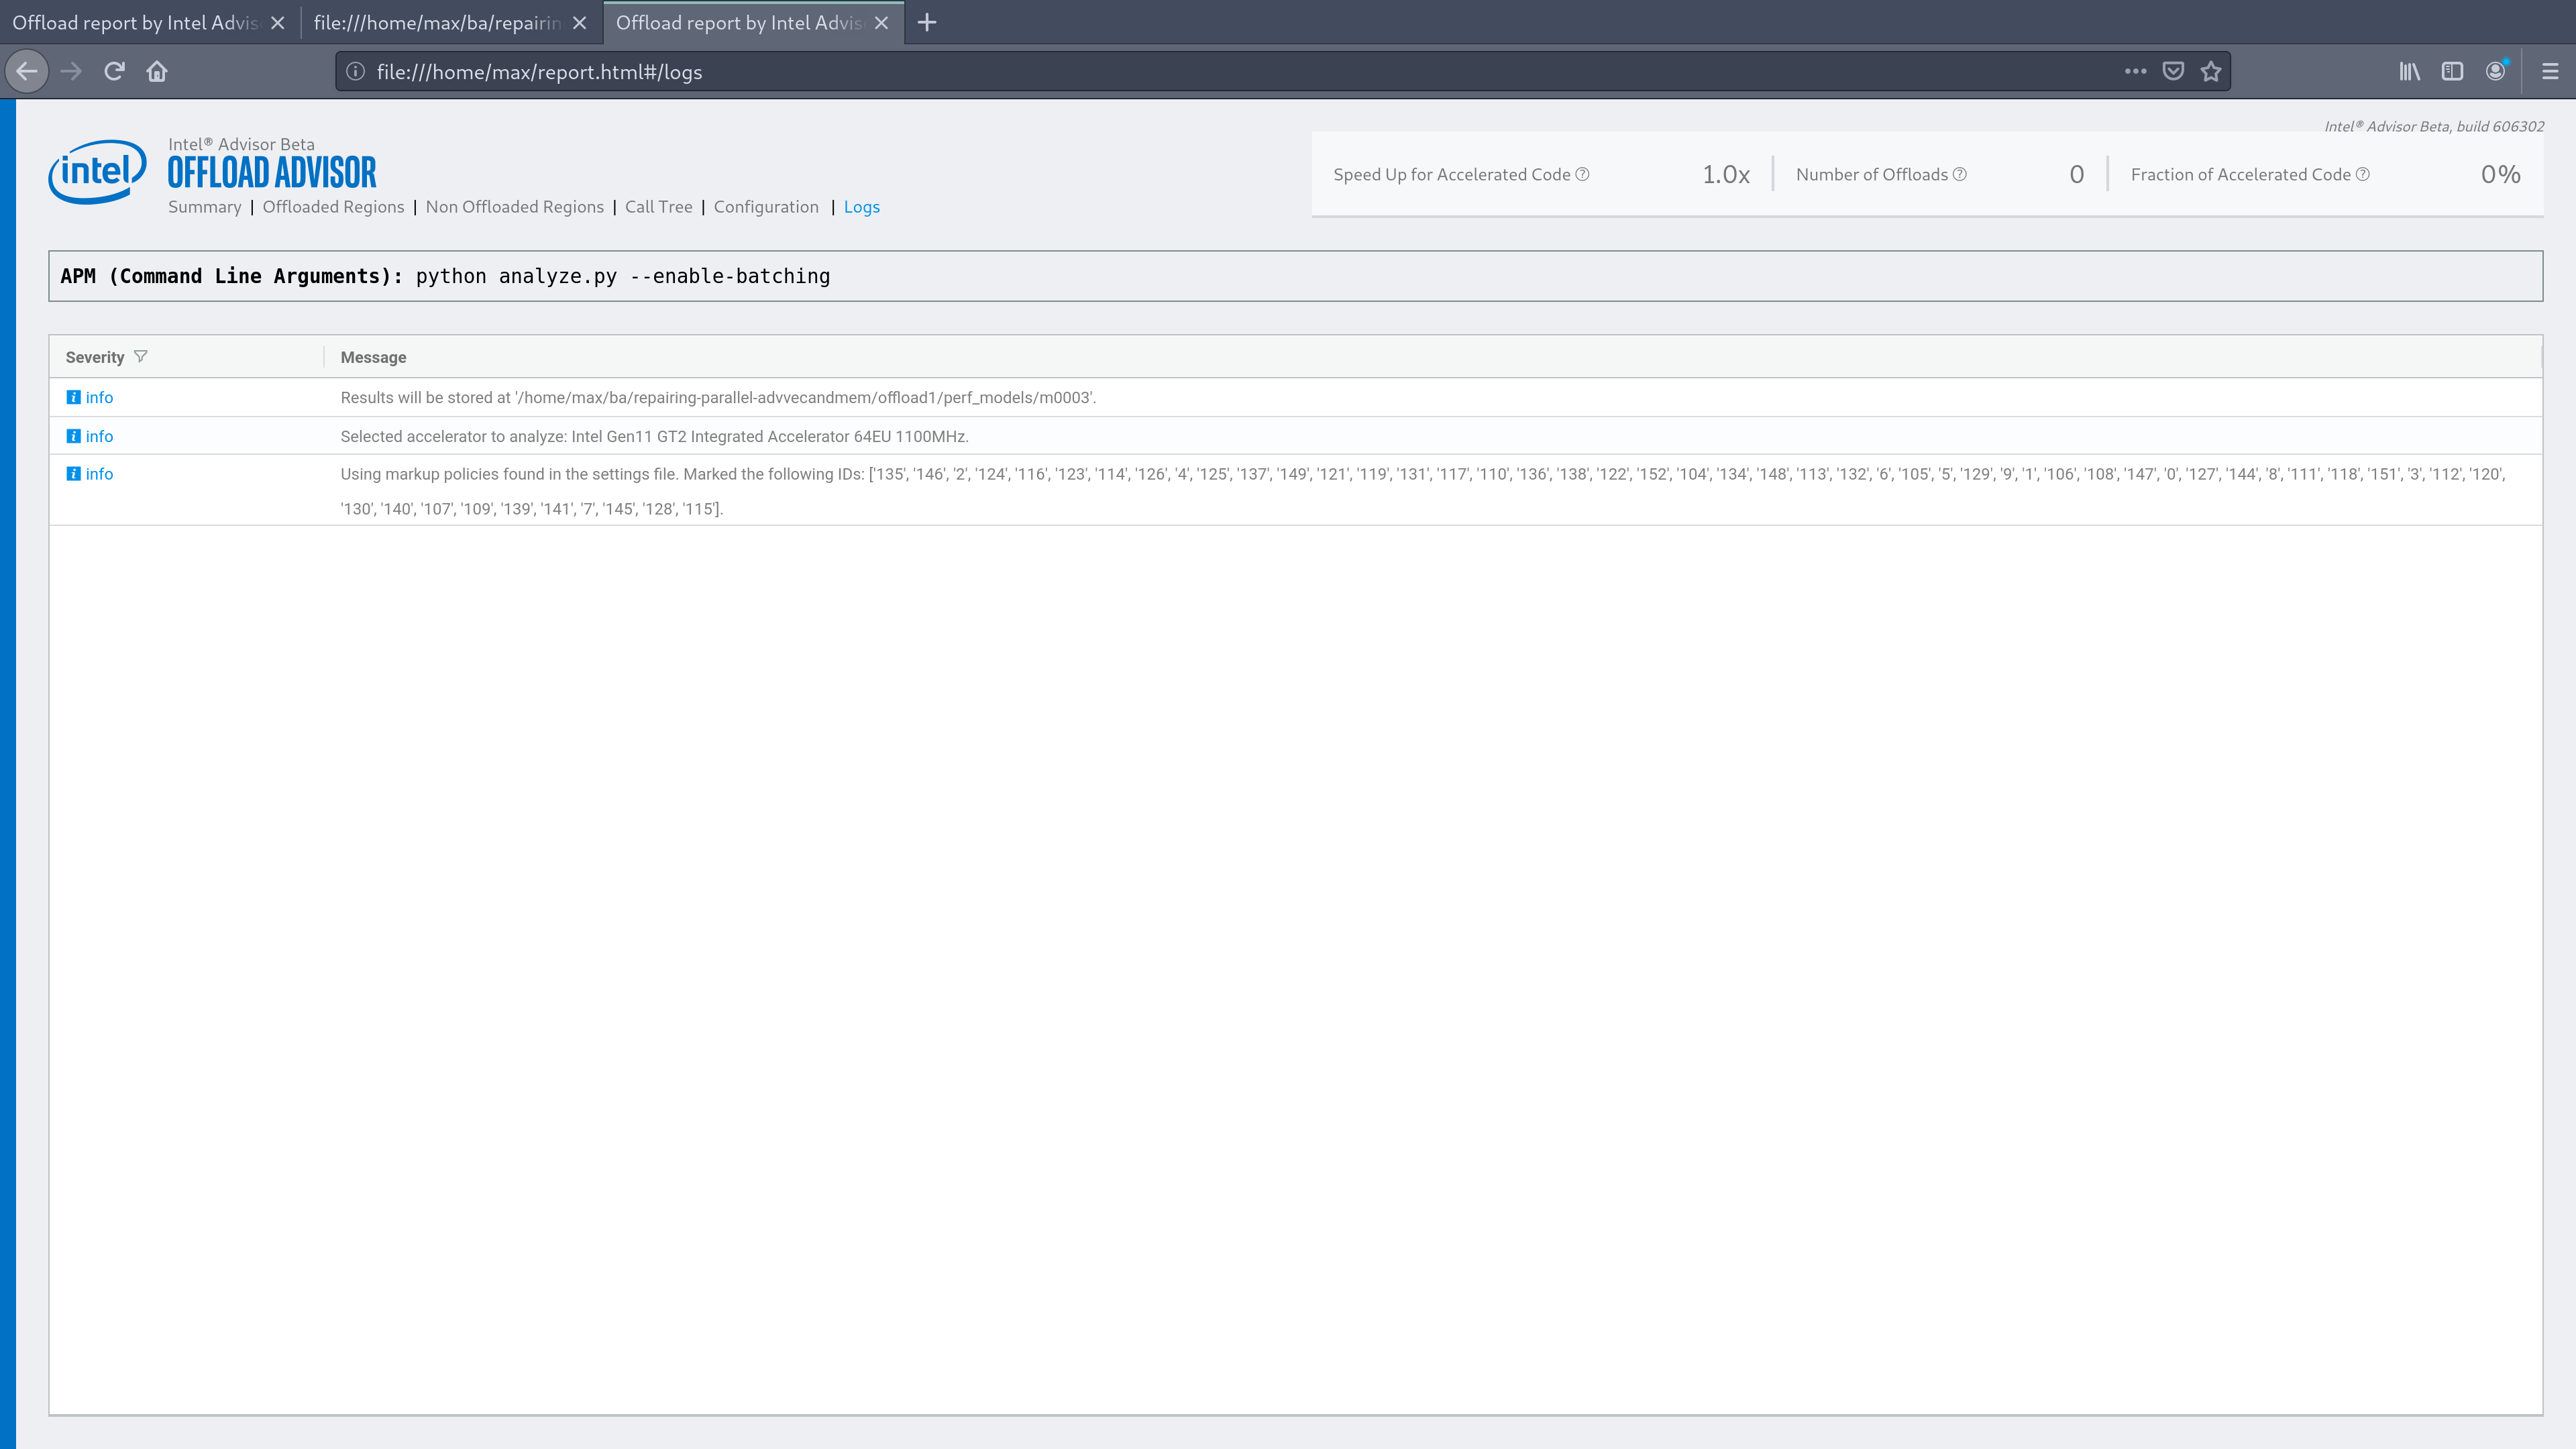
I used collect.py, it finished without error.
I've attached the output of ls; the XML is valid.
Thanks again!
- Mark as New
- Bookmark
- Subscribe
- Mute
- Subscribe to RSS Feed
- Permalink
- Report Inappropriate Content
It seems Trip Counts analysis haven't finished correct. We need reproducer to better understand the issue.
If it's possible, could you please share executable, instructions how to run it and environment description, including OS version.
- Mark as New
- Bookmark
- Subscribe
- Mute
- Subscribe to RSS Feed
- Permalink
- Report Inappropriate Content
I've attached a modified version of the code with some stuff removed, which exhibits the exact same behaviour. To run, cd into /src, do make repair. repair.out is the executable of concern.
I'm using Ubuntu 20 (Linux 5.4.0-40-generic). What other environment information would be useful?
Might the problem simply be that none of the loops are actually suitable to offload? (too branchy, memory intensive, ...) Or would that show in some other way? (Sorry if that's obvious, I'm using offload analysis for the first time)
Thank you very much for your help!
- Mark as New
- Bookmark
- Subscribe
- Mute
- Subscribe to RSS Feed
- Permalink
- Report Inappropriate Content
Hey,
I am very thankful for your help and am fully aware that this is not a very high priority problem for you, so I am asking for planning purposes only: is there some timeline on when you might be able to take a look at this?
Thanks a lot again!
- Mark as New
- Bookmark
- Subscribe
- Mute
- Subscribe to RSS Feed
- Permalink
- Report Inappropriate Content
Hi!
The reproducer shared by you was helpful; the investigation is work in progress. I don't expect quick response this week, but probably next week we should have some news for you.
Thanks!
- Mark as New
- Bookmark
- Subscribe
- Mute
- Subscribe to RSS Feed
- Permalink
- Report Inappropriate Content
Hello @lm1909 ,
I tried to reproduce the issue and got process termination due to insufficient memory:
Jul 20 11:47:21 10 kernel: Out of memory: Kill process 200560 (repair.out) score 594 or sacrifice child
Jul 20 11:47:21 10 kernel: Killed process 200560 (repair.out) total-vm:56955948kB, anon-rss:38542364kB, file-rss:8kB, shmem-rss:24kB
Please pay attention that Advisor collections require additional memory for data collection and analysis. Volume of additional memory depends on target application internals. I guess that You probably met the same problem. Is there a way to reduce working size?
- Mark as New
- Bookmark
- Subscribe
- Mute
- Subscribe to RSS Feed
- Permalink
- Report Inappropriate Content
Hey @Dmitry_Dontsov!
Thank you!
And yes that is an issue; the memory usage can be reduced by reducing the constants in config.hh; the computational workload can be adapted via the loopcount in repair.cc:188 and the first argument (instead of 70.000) in repair.cc:217 (lower is faster in both cases).
I've attached a version that is confifured to run faster and consume less memory.
Thanks again!
- Mark as New
- Bookmark
- Subscribe
- Mute
- Subscribe to RSS Feed
- Permalink
- Report Inappropriate Content
Thank You!
Now data collection works well, but analysis stage is fail due to not enough memory. We are working on that.
- Mark as New
- Bookmark
- Subscribe
- Mute
- Subscribe to RSS Feed
- Permalink
- Report Inappropriate Content
Dear @lm1909 ,
Could You please restart your experiment with additional option for collect.py "--no-track-heap-objects"? It should help, but precision will be a little bit lower.
- Mark as New
- Bookmark
- Subscribe
- Mute
- Subscribe to RSS Feed
- Permalink
- Report Inappropriate Content
Hey @Dmitry_Dontsov,
Thanks for the advice! - I'm going to try this today.
- Mark as New
- Bookmark
- Subscribe
- Mute
- Subscribe to RSS Feed
- Permalink
- Report Inappropriate Content
Thanks a lot @Dmitry_Dontsov, this actually solved the problem!
Do I understand correctly that the problem was that there was simply too much workload of the analzyed programm / not enough memory on my machine? Maybe it would be a good idea to add that to the troubleshooting page.
However there is one thing I'm wondering about: how much is the impact on precision with this flag? Is there maybe some documentation? I also tried to offload analyse the same programm without --no-track-heap-objects but with much lower workload (even lower than the second version I attached in this thread) and this also worked, however the performance prediction for offloading is considerably less optimistic. Which result should I trust more?
Thanks very much again!
- Mark as New
- Bookmark
- Subscribe
- Mute
- Subscribe to RSS Feed
- Permalink
- Report Inappropriate Content
Hi @lm1909 ,
Offload Advisor can use two methods to estimate data transfer: first is memory object based, second is memory page based. With the keys "--track-memory-objects" and "--no-track-memory-objects" you can switch between these methods ("--(no-)track-heap-objects" is just old name for this flag). Tracking memory objects is default method, because usually it enables gathering more information, make more precise estimation and in addition, show list of the objects to user.
About model accuracy. From one hand, for memory object based method it's assumed user transfer the whole objects, for memory page based method it's assumed user can split his memory objects into several parts and transfer only useful part. From the other hand, memory object based method can be more precise for small objects, because memory page based method has page size granularity (4k by default). So if you assume transferring the whole objects and objects are small, memory object based method is more precise. If you assume splitting objects, memory page based method is more precise. Unfortunately it's very hard to make common quantitative estimation of model accuracy and analysis overhead, because it depends on the workload.
Each method uses kind of shadow memory to store information about found objects. That's why application under analysis requires much memory than application itself. Big size of shadow memory is the reason of the "low memory" issue you faced. From point of view of required memory size, if average memory object size is big enough, it's better to use memory object method, otherwise track pages.
In general, big number of memory objects should not be an issue for performance modelling (the last issue you faced). But in the current implementation there is sub-optimal algorithm of filtering memory objects. We plan to fix it. This algorithm only works when memory object based method used. If you switch to memory page based method, data transfer traffic in bytes will be estimated with different code (it's just num_pages * page_size).
As for updating documentation and troubleshooting guide: thank you, that's very useful suggestion.
If you faced significant change of data transfer traffic when switching memory object- to memory page based method, please let us know.
- Mark as New
- Bookmark
- Subscribe
- Mute
- Subscribe to RSS Feed
- Permalink
- Report Inappropriate Content
Hi!
As a follow-up question to your recent reply: how did you run offload advisor exactly?
Did you use collect.py with default parameters for profiling stage?
Also, just in case, do you have some hotspot for-loops?
Also how do you compiler your application (any specific compilation flags)? Is this possible you've been doing binary stripping (separating debug info into another file)?
- Mark as New
- Bookmark
- Subscribe
- Mute
- Subscribe to RSS Feed
- Permalink
- Report Inappropriate Content
Hi!
Yes I used collect.py (with default parameters), to be concrete I used:
advixe-python $APM/collect.py -- ./executable
advixe-python $APM/analyze.py ../project --enable-batching
Yes, the loops shown at the very top in the screenshots are some of the hotspots.
And no I didn't, I used the compiler flags:
-O2 -std=c++11 -fopenmp -g -no-ipo -debug inline-debug-info
Thanks!
- Subscribe to RSS Feed
- Mark Topic as New
- Mark Topic as Read
- Float this Topic for Current User
- Bookmark
- Subscribe
- Printer Friendly Page