- Mark as New
- Bookmark
- Subscribe
- Mute
- Subscribe to RSS Feed
- Permalink
- Report Inappropriate Content
Dear VTune Forum experts,
Thank you so much for sharing your expertise.
Much appreciated.
When I copy the General Exploration analysis in VTune and add additional counters, for example the counters for analyzing
the reasons of Machine Clears, we are unable to drill down on the Backend Bound in the results. Is this the expected behavior?
I’ve heard that this maybe a bug in the version we are using but I wanted to make sure. (2017u4)
Your valuable expertise in sharing pointers and resources is highly appreciated
Best Regards,
M Jay
Link Copied
- Mark as New
- Bookmark
- Subscribe
- Mute
- Subscribe to RSS Feed
- Permalink
- Report Inappropriate Content
Hi M Jay,
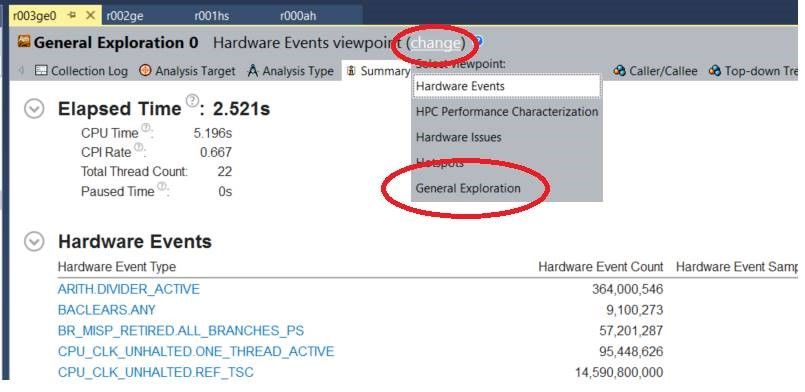
Before investigating this further I would like to know which viewpoint are you using? By default, for a custom analysis, you will get the "Hardware Events" viewpoint. Use the dropdown to change to the General Exploration Viewpoint. The GE Viewpoint should be available as long as you collected all the required events.

- Subscribe to RSS Feed
- Mark Topic as New
- Mark Topic as Read
- Float this Topic for Current User
- Bookmark
- Subscribe
- Printer Friendly Page
