- Mark as New
- Bookmark
- Subscribe
- Mute
- Subscribe to RSS Feed
- Permalink
- Report Inappropriate Content
Today I’ll continue telling the story of VTune Amplifier development. Last month we focused on “housekeeping activities”. You know, maintenance of such a product is quite an effort :) Among other things we extended test coverage, fixed some bugs. Hopefully, you might find it useful in next releases. :) We also added a validation script that checks how your system matches the VTune Amplifier requirements and shows the diagnostics. It is described here
But besides “housekeeping” there were other things that kept us busy last month:
Cloud profiling: We continue polishing a profiling flow for various cloud environments. You can find a couple of articles in our cookbook: Profiling JavaScript* Code in Node.js* and Profiling PHP Code Running with HHVM*
Support for AI frameworks: We started looking at profiling of the most popular Artificial Intelligence Frameworks. TensorFlow* example is described in this article.
I/O performance: Currently we pay lots of our attention to I/O aspects, especially on SPDK and DPDK fronts. Some examples to illustrate are available in these articles: How to detect “Non-local socket” I/O issues with Intel® VTune™ Amplifier and Analyzing Open vSwitch* with DPDK Bottlenecks Using Intel® VTune™ Amplifier. More info is coming. :)
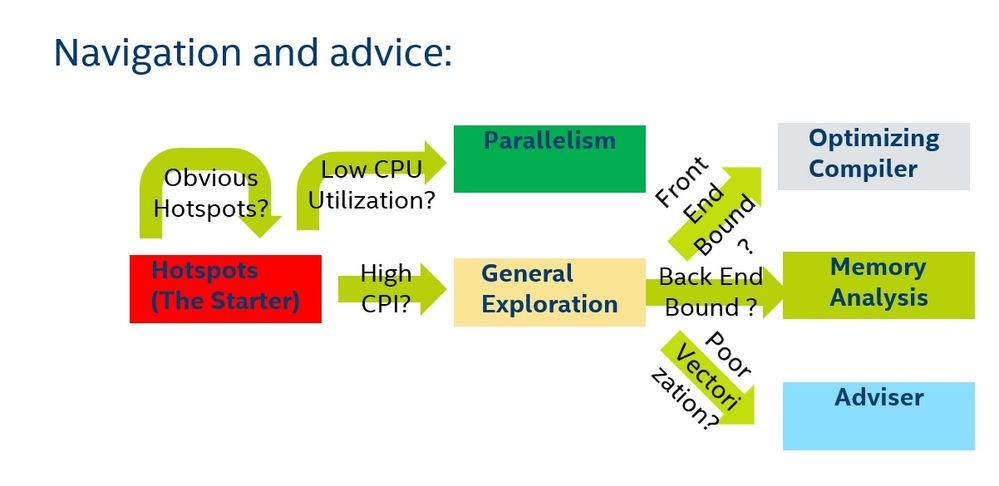
Last, but not the least. We are thinking currently how to make the profiling/tuning flow with our tool more intuitive and user-friendly. Below are three goals we are pursuing:
-
Introduce an obvious starting point for analysis.
-
Provide navigation guidance thru analysis types.
-
Call out basic tuning techniques for detected performance issues.
So far I’ve got the following picture in my head (note, it might change dramatically :))

So, a question to you, guys:
Does it echo your needs?
Grateful in advance for the response,
Valery
Link Copied
- Mark as New
- Bookmark
- Subscribe
- Mute
- Subscribe to RSS Feed
- Permalink
- Report Inappropriate Content
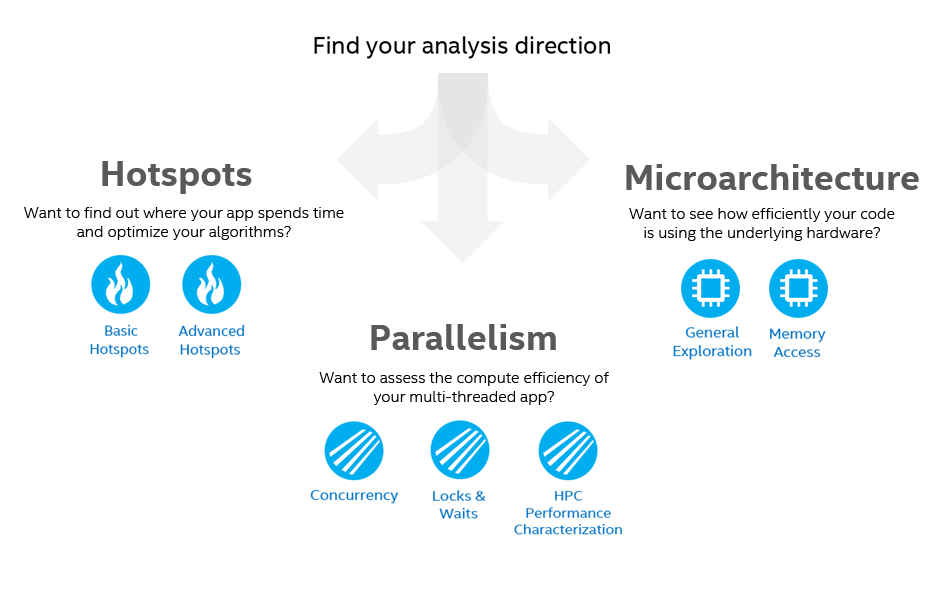
Introduce an obvious starting point for analysis.
Provide navigation guidance thru analysis types.
Personally, I like the "Find your analysis" diagram (link on the welcome page) which was added in VTune 2018:
But, obviously, this should be somehow integrated in the UI.
- Subscribe to RSS Feed
- Mark Topic as New
- Mark Topic as Read
- Float this Topic for Current User
- Bookmark
- Subscribe
- Printer Friendly Page
