- Mark as New
- Bookmark
- Subscribe
- Mute
- Subscribe to RSS Feed
- Permalink
- Report Inappropriate Content
I have encountered a problem when using VTune to find hotspots in a large program I am developing. It appears that VTune is not capable of properly identifying names of functions comprising hotspots and their associated call stacks when the code is compiled with optimization enabled (e.g. /O2).
To illustrate the problem, I have generated a simple example:
#include <stdio.h>
#include <omp.h>

double largesum(int Ncores, long long int Nterms, double* result) {
	double sum = 0;
	double time;
	omp_set_num_threads(Ncores);
	time = omp_get_wtime();
#pragma omp parallel for reduction(+ : sum)
	for (long long int i = 1; i <= Nterms; i++) {
		double id=(double)i;
		sum += 1.0 / (id * id);
	}
	time = omp_get_wtime() - time;
	*result = sum;
	return time;
}

int main()
{
	double result, time,Ncores;
	long long int Nterms;
	Ncores = 1;
	Nterms = (long long int)1e8;
	time=largesum(Ncores, Nterms, &result);
	printf("Result: %f\nTime: %f\n", result, time);
}
I.e. the program calculates the value of large convergent sum with 1e8 terms. The sum is calculated in the function largesum()
I can first compile the code (using Windows 10. and version 19.0/19.1 of the Intel Compiler) without optimization. E.g:
icl Speedtestconsole.cpp /Od /Qopenmp /Zi
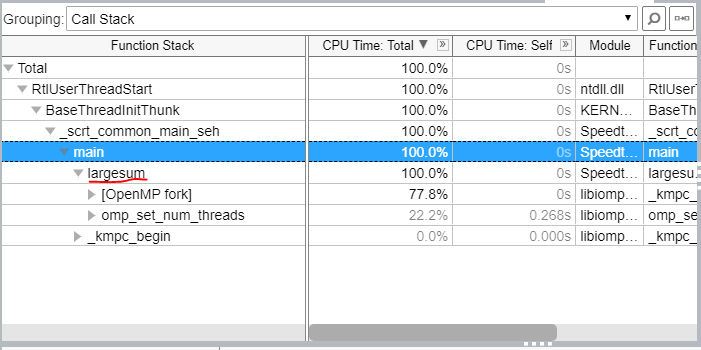
When analysing the result in VTune "Hotspots", it can be seen that largesum() is recognized as a CPU-intensive function:
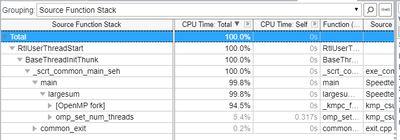
However, compiling the program with optimization:
icl Speedtestconsole.cpp /O2 /Qopenmp /Zi
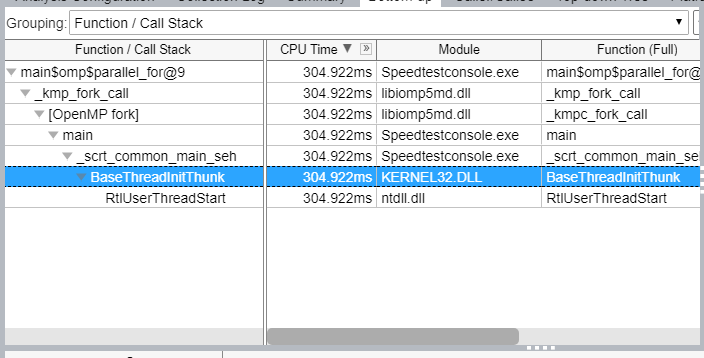
results in this:
In this case, the function largesum() is never identified.
I also tried adding more of the recommended compiler settings (/MD, /debug:full or /debug:inline-debug-info ), but without any luck. I would really like to be able with optimizations enabled.
Does anybody know what the problem might be?
- Mark as New
- Bookmark
- Subscribe
- Mute
- Subscribe to RSS Feed
- Permalink
- Report Inappropriate Content
The difference is in VS version.
Tried VS12 and VS14.
Looks like VS14 linker does not save debug info for inlines and stack is without largesum.
Kirill
Link Copied
- Mark as New
- Bookmark
- Subscribe
- Mute
- Subscribe to RSS Feed
- Permalink
- Report Inappropriate Content
Hi ,
Thank you for posting in Intel Forum.
We are trying to reproduce the issue from our end. We will get back to you soon.
Raeesa
- Mark as New
- Bookmark
- Subscribe
- Mute
- Subscribe to RSS Feed
- Permalink
- Report Inappropriate Content
Hi.
Looks like compiler inlined this function.
I've added
__declspec(noinline)
double largesum(int Ncores, long long int Nterms, double* result) {
....
To your sample and got the stack
- Mark as New
- Bookmark
- Subscribe
- Mute
- Subscribe to RSS Feed
- Permalink
- Report Inappropriate Content
Dear Kirill,
Thank you for your response. This works and makes good sense.
In a more complicated setting, where a program might contain calls to thousands of different functions, what would then be a good profiling approach?
I can see that it is possible to disable all inlining with /Ob0 (or -fno-inline), and that does enables me to see the workload of individual functions. However, I imagine that inlining could affect performance quite a bit, and that results from profiling with or without inlining would likely be similarly affected.
Therefore, I think it would be quite meaningful to somehow be able to see the (virtual) workload of inlined functions. Profiling a program with inling disabled might give a wrong picture of where the workload is located.
Does that make sense, or am I asking for something that is simply not possible?
Thanks,
Kenni
- Mark as New
- Bookmark
- Subscribe
- Mute
- Subscribe to RSS Feed
- Permalink
- Report Inappropriate Content
Hi,
To stay optimization and get inlines in stacks, I suggest to use /debug:inline-debug-info to generate debug info for inlines.
Kirill
- Mark as New
- Bookmark
- Subscribe
- Mute
- Subscribe to RSS Feed
- Permalink
- Report Inappropriate Content
Dear Kirill,
I gave it a shot, but apparently, I was unable to find the inlined function in Vtune. I used the following compiler command:
icl Speedtestconsole.cpp /O2 /debug:inline-debug-info /Qopenmp /Zi
Should, this be done differently?
Cheers,
Kenni
- Mark as New
- Bookmark
- Subscribe
- Mute
- Subscribe to RSS Feed
- Permalink
- Report Inappropriate Content
Hm, I used the same 'icl Speedtestconsole.cpp /O2 /Qopenmp /Zi /debug:inline-debug-info'
- Mark as New
- Bookmark
- Subscribe
- Mute
- Subscribe to RSS Feed
- Permalink
- Report Inappropriate Content
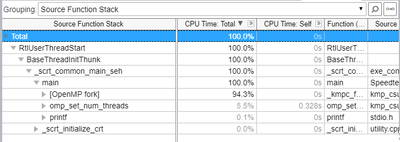
Strange. I tried to use the exact same compiler command, and Vtune shows:
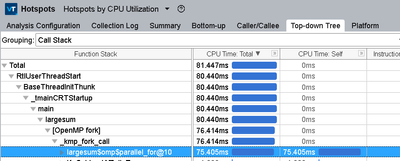
If I invoke the "__declspec(noinline)" directive and use the same compilation option, I do see the function:
Vtune version 2019 Update 6.
- Mark as New
- Bookmark
- Subscribe
- Mute
- Subscribe to RSS Feed
- Permalink
- Report Inappropriate Content
Tried the same VTne version, inline was in stack.
Looks like that depends on compiler.
what is your compiler version?
icl on my side
Intel(R) C++ Intel(R) 64 Compiler for applications running on Intel(R) 64, Version 19.0.4.228 Build 20190417
Copyright (C) 1985-2019 Intel Corporation. All rights reserved.
I think
- Mark as New
- Bookmark
- Subscribe
- Mute
- Subscribe to RSS Feed
- Permalink
- Report Inappropriate Content
Hi Kirill,
I have tried testing this on two different machines with slightly different machines with different versions:
#1:
Intel compiler: 19.1.2.254
Vtune: 2020 Update 2
#2:
Intel compiler: 19.0.5.281
Vtune: 2019 Update 6
In both cases, I was unable to see the inlined function with the suggested compiler/linker settings.
Cheers,
Kenni
- Mark as New
- Bookmark
- Subscribe
- Mute
- Subscribe to RSS Feed
- Permalink
- Report Inappropriate Content
Hi, Kenni.
Could you attach your binaries (exe + pdb)? I'll try on my side.
Thanks, Kirill
- Mark as New
- Bookmark
- Subscribe
- Mute
- Subscribe to RSS Feed
- Permalink
- Report Inappropriate Content
Hi Kirill,
Thank you for looking into this.
Binaries are attached.
Cheers,
Kenni
- Mark as New
- Bookmark
- Subscribe
- Mute
- Subscribe to RSS Feed
- Permalink
- Report Inappropriate Content
The difference is in VS version.
Tried VS12 and VS14.
Looks like VS14 linker does not save debug info for inlines and stack is without largesum.
Kirill
- Mark as New
- Bookmark
- Subscribe
- Mute
- Subscribe to RSS Feed
- Permalink
- Report Inappropriate Content
Thanks Kirill,
That makes sense. I did not realize until now that the command-line I invoke from the shortcut built by the Intel Parallel Studio sets up the compiler environment to use the VS linker.
Since my original problem (and not the small example considered here), involves a Windows application that I develop using VS, I suppose I will have to wait and see if outputting inline-debug-information is something MS decides to fix at some point.
But thank you very much. I still learned a lot
Cheers,
Kenni
- Mark as New
- Bookmark
- Subscribe
- Mute
- Subscribe to RSS Feed
- Permalink
- Report Inappropriate Content
/debug:inline-debug-info option is deprecated; it is only valuable with old versions of Visual Studio and Intel Compiler. The debugging information generated for inline functions by modern versions of VS and Intel Compilers is not supported by VTune.
BTW, largesum is not a CPU-intensive function in this sample; It has 0 CPU Time (see the CPU Time:Self column); most of the work is done in the OpenMP parallel region.
- Mark as New
- Bookmark
- Subscribe
- Mute
- Subscribe to RSS Feed
- Permalink
- Report Inappropriate Content
Hi Denis,
Ok, thank you for pointing that out. Is there some other recommended approach than using VTune then?
Regarding the function being CPU-intensive: Right, it is not in the presented version, but increase Nterms to, say, (long long int)1e10 or even higher, and it should start to be CPU-intensive, right?
BTW, I just tried to run with 1e11 terms in the sum and got this result:
It is interesting that the type cast is so CPU-intensive compared to the sum-increment line which both involves an addition, a division and a multiplication. However, when optimization is disabled, most of the workload is indeed in the sum-increment-line.
- Mark as New
- Bookmark
- Subscribe
- Mute
- Subscribe to RSS Feed
- Permalink
- Report Inappropriate Content
I think there will be a separate internal function created for the OpenMP loop: largesum$omp$parallel_for and most of CPU time will be attributed to it. Increasing Nterms shouldn't affect largesum because the loop with all computations will be moved to largesum$omp$parallel_for.
- Mark as New
- Bookmark
- Subscribe
- Mute
- Subscribe to RSS Feed
- Permalink
- Report Inappropriate Content
>>>It is interesting that the type cast is so CPU-intensive compared to the sum-increment line which both involves an addition, a division and a multiplication. However, when optimization is disabled, most of the workload is indeed in the sum-increment-line.>>>
You should look at ICC generated assembly for those two optimization levels. For such a high number of loop trip count (1e11) the convergence of precision in sampling mode should be good and you can look at assembly and see which lines of machine code were marked as hotspot "contributors".
- Mark as New
- Bookmark
- Subscribe
- Mute
- Subscribe to RSS Feed
- Permalink
- Report Inappropriate Content
Hi,
Glad that your issue got resolved. We are discontinuing monitoring this thread. Please raise a new thread if you have any further queries.
Raeesa
- Subscribe to RSS Feed
- Mark Topic as New
- Mark Topic as Read
- Float this Topic for Current User
- Bookmark
- Subscribe
- Printer Friendly Page
