- Mark as New
- Bookmark
- Subscribe
- Mute
- Subscribe to RSS Feed
- Permalink
- Report Inappropriate Content
I have a Dell 7760 Mobile Workstation with the 8 core Tiger Lake H processor running Fedora 34 and I have installed the oneAPI Base and HPC toolkits. The installation of the SEP driver fails during the installation of the Base toolkit. So, I have attempted to install the SEP driver manually. Here is the current output of the "insmod-sep -q" command.
# ./insmod-sep -q
pax driver is loaded and owned by group "vtune" with file permissions "660".
socperf3 driver is loaded and owned by group "vtune" with file permissions "660".
sep5 driver is loaded and owned by group "vtune" with file permissions "660".
socwatch driver is loaded and owned by group "vtune" with file permissions "660".
vtsspp driver is loaded and owned by group "vtune" with file permissions "660".
However, when I run Application Performance Snapshot (APS) on one of my test codes, I receive the following warning message.
" Average DRAM Bandwidth: N/A
| Data for this metric is not collected since it requires system-wide
| performance monitoring. Make sure the sampling driver is properly installed on
| your system: https://software.intel.com/en-us/vtune-amplifier-help-sep-driver.
| Otherwise, enable a driverless Perf-based sampling collection by setting the
| /proc/sys/kernel/perf_even_paranoid value to 0 or less."
Also, I have set perf_event_paranoid to -1 as follows.
# cat /proc/sys/kernel/perf_event_paranoid
-1
Are there any suggestions about what may be going wrong or how to debug this issue.
Thanks,
Dave
Link Copied
- Mark as New
- Bookmark
- Subscribe
- Mute
- Subscribe to RSS Feed
- Permalink
- Report Inappropriate Content
Also, I have added my user name to the "vtune" unix group.
Thanks,
Dave
- Mark as New
- Bookmark
- Subscribe
- Mute
- Subscribe to RSS Feed
- Permalink
- Report Inappropriate Content
Also, I should have the latest version of the Base and HPC kits installed as of yesterday. Here is what I have installed.
intel-basekit.x86_64 2021.4.0-3422 @OneAPI
intel-basekit-getting-started.noarch 2021.4.0-3422 @OneAPI
intel-hpckit.x86_64 2021.4.0-3347 @OneAPI
intel-hpckit-getting-started.noarch 2021.4.0-3347 @OneAPI
Thanks,
Dave
- Mark as New
- Bookmark
- Subscribe
- Mute
- Subscribe to RSS Feed
- Permalink
- Report Inappropriate Content
Hi,
Good day to you.
Thanks for posting in Intel Communities.
Appreciate the effort in providing all the above information to us. To help you better, can you make sure that the VTune self-checker script is running fine. This is to validate that appropriate drivers are installed and the system is set up properly to collect the performance data.
The self-checker file for Linux is "vtune-self-checker.sh" which will be present in the <vtune-installation-directory>/bin64 folder. On running this script, it will create a log file and display the location of the log file. Kindly share that file with us so that we can verify it from our side.
Regards,
Jyothis V James
- Mark as New
- Bookmark
- Subscribe
- Mute
- Subscribe to RSS Feed
- Permalink
- Report Inappropriate Content
Hi Jyothis,
Thanks for your reply. Attached is the log file generated by running the vtune-self-checker.sh script. Is there any other info that you need?
Thanks,
Dave
- Mark as New
- Bookmark
- Subscribe
- Mute
- Subscribe to RSS Feed
- Permalink
- Report Inappropriate Content
Hi,
Sorry for the delay.
Thanks for providing us with the self-checker logs. The log says that the SEP drivers are installed correctly but some issues are detected while running the analysis.
Can you try running the following commands:
/opt/intel/oneapi/vtune/2021.9.0/bin64/vtune -collect hotspots -r /tmp/H_RUN/ -data-limit 0 -finalization-mode none -- <your_application_absolute_path>
/opt/intel/oneapi/vtune/2021.9.0/bin64/vtune -collect performance-snapshot -r /tmp/PS_RUN/ -data-limit 0 -finalization-mode none -- <your_application_absolute_path>
For eg:
/opt/intel/oneapi/vtune/2021.9.0/bin64/vtune -collect hotspots -r /tmp/H_RUN/ -data-limit 0 -finalization-mode none -- /opt/intel/oneapi/vtune/2021.9.0/samples/en/C++/matrix/matrix
/opt/intel/oneapi/vtune/2021.9.0/bin64/vtune -collect performance-snapshot -r /tmp/PS_RUN/ -data-limit 0 -finalization-mode none -- /opt/intel/oneapi/vtune/2021.9.0/samples/en/C++/matrix/matrix
provided "/opt/intel/oneapi/vtune/2021.9.0/samples/en/C++/matrix/matrix" is the test application's absolute path
These commands will create two directories called PS_RUN and H_RUN inside your /tmp directory, kindly zip the contents of both the folders and attach them so that we can investigate this issue further. It would also be helpful if you can provide us with a sample reproducer code from your test code so that we could try it from our end as well.
Regards,
Jyothis V James
- Mark as New
- Bookmark
- Subscribe
- Mute
- Subscribe to RSS Feed
- Permalink
- Report Inappropriate Content
Hi Jyothis,
Thanks for your reply. Attached are the results you asked for. What would you like for the reproducer code? Do you
want source code and a build script or just an executable?
Thanks,
Dave
- Mark as New
- Bookmark
- Subscribe
- Mute
- Subscribe to RSS Feed
- Permalink
- Report Inappropriate Content
Hi,
Thanks for providing us with the report and logs.
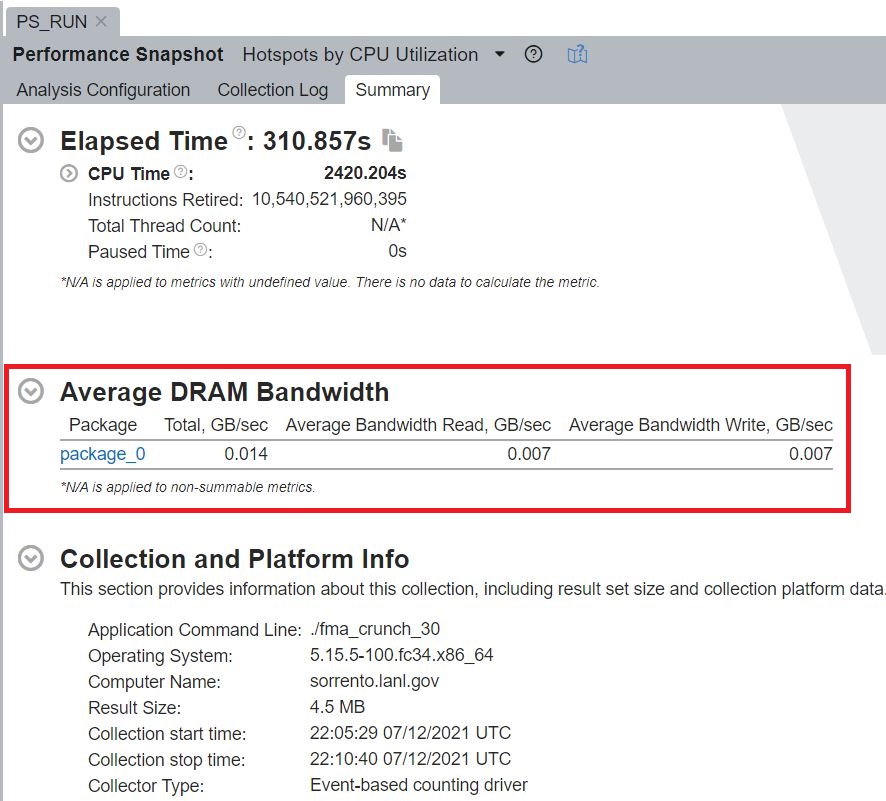
The command "vtune -collect performance-snapshot -r /tmp/PS_RUN/ -data-limit 0 -finalization-mode none -- <your_application_absolute_path>" did generate an Application Performance Snapshot (APS) report for your application which you shared with us. There are no issues with the report and it correctly analysis the Average DRAM Bandwidth that you mentioned earlier (see attached screenshot).
The output provided by the command line is limited. So, instead of viewing the report in the command line, it is recommended to view the report in the GUI for a detailed analysis.
The -r flag given in the vtune command is used to specify the location to save the result and report of the analysis. This folder can be copied to any computer and viewed using VTune installed on that system. Check the below link on how to view the generated command-line results in the GUI:
You can also access the web interface of VTune by running the following command on the system where the profiling is expected to be performed and accessing the generated link from your system's browser:
vtune-backend --allow-remote-ui
>> What would you like for the reproducer code? Do you want source code and a build script or just an executable?
If you are still facing issues while performing Application Performance Snapshot, do share the executable file with us so that we could try analyzing it from our end.
Hope this helps.
Regards,
Jyothis V James
- Mark as New
- Bookmark
- Subscribe
- Mute
- Subscribe to RSS Feed
- Permalink
- Report Inappropriate Content
Hi,
Good day to you.
Is your issue resolved? Could you please give us an update?
Thanks and Regards,
Jyothis V James
- Mark as New
- Bookmark
- Subscribe
- Mute
- Subscribe to RSS Feed
- Permalink
- Report Inappropriate Content
I still get build failures for the socwatch driver when trying to install 2022.1.0 on my Fedora 34 laptop. Also when trying to manually run the driver build script. The build fails with a "mv" command. I think I will try again next week when I believe there will be a patch release for 2022.1.0.
- Mark as New
- Bookmark
- Subscribe
- Mute
- Subscribe to RSS Feed
- Permalink
- Report Inappropriate Content
Hi,
Thanks for getting back to us.
We could reproduce your issue. We are working on this internally, we will get back to you soon with an update.
Regards,
Jyothis V James
- Mark as New
- Bookmark
- Subscribe
- Mute
- Subscribe to RSS Feed
- Permalink
- Report Inappropriate Content
Hi,
Thanks for your patience.
Our development team is working on this issue internally and is expected to be fixed on the next release.
For the time being, the workaround solution is to remove the file that is causing the issue and rebuild the driver.
Before building the driver, make sure you are using the latest kernel released for Fedora 34 installed and running. Along with this, make sure kernel-devel and kernel-headers packages are installed. You can do this by running the following commands:
$ sudo dnf install kernel --best
$ sudo dnf install kernel-devel kernel-headers
Once this is done, reboot the system.
Next, try building the driver using the below command:
$ <oneapi_install_directory>/vtune/latest/sepdk/src/build-driverThis will end up with a mv error which you mentioned earlier.
Remove the socwatch*.ko file that is generated in the following directory:
<oneapi_install_directory>/vtune/latest/sepdk/src/socwatch/drivers/
Then, try re-building the driver using the same command which was used earlier:
$ <oneapi_install_directory>/vtune/latest/sepdk/src/build-driver
The driver build will be successful. Once this is done, load the drivers by running the following commands
$ sudo <oneapi_install_directory>/vtune/latest/sepdk/src/insmod-sep
$ sudo <oneapi_install_directory>/vtune/latest/sepdk/src/insmod-socwatch
You can check the status of the loaded drivers using below command:
$ sudo <oneapi_install_directory>/vtune/latest/sepdk/src/insmod-sep -q
If this resolves your issue, make sure to accept this as a solution. This would help others with a similar issue.
Thanks and Regards,
Jyothis V James
- Mark as New
- Bookmark
- Subscribe
- Mute
- Subscribe to RSS Feed
- Permalink
- Report Inappropriate Content
Hi,
Good day to you.
Is your issue resolved? Could you please give us an update?
Thanks and Regards,
Jyothis V James
- Mark as New
- Bookmark
- Subscribe
- Mute
- Subscribe to RSS Feed
- Permalink
- Report Inappropriate Content
Hi,
Good day to you.
We assume that your issue is resolved. If you need any additional information, please post a new question as this thread will no longer be monitored by Intel.
Regards,
Jyothis V James
- Mark as New
- Bookmark
- Subscribe
- Mute
- Subscribe to RSS Feed
- Permalink
- Report Inappropriate Content
I think this issue is resolved for me in that I am able to manually build and install the SEP driver. I expect to need to update my OS again soon and I will try the above procedure when I do and see if it is simpler than my manual approach.
Thanks,
Dave
- Subscribe to RSS Feed
- Mark Topic as New
- Mark Topic as Read
- Float this Topic for Current User
- Bookmark
- Subscribe
- Printer Friendly Page