- Mark as New
- Bookmark
- Subscribe
- Mute
- Subscribe to RSS Feed
- Permalink
- Report Inappropriate Content
Hello,
I'm using VTune CLI to run custom 'runsa' analysis on our remote SkyLake server. The collector is a perf driverless. VTune seems to reject the custom event-config modifiers. By inspecting the contents of "perfcmd", "sep.events", "map.events" it is clear that default modifiers are used by the perf collector. It is not clear which program is responsible for that. There is no warning message.
Secondly I'm interested only in user mode counting and by looking at the perfcmd file the "uk" modifier is appended to perf raw event, beside that it is not clear if sep "pdir" modifier is a directly translated to perf "ppp" highest level of skid reduction.
The vtune cli is launched by the python script and here the arguments (copied from vtune log)
/opt/intel/vtune_profiler/bin64/vtune -finalization-mode=none -target-pid=24851 -r /tmp/vtune_data -collect-with runsa -knob event-config=CPU_CLK_UNHALTED.THREAD:sa=1000000:OS=no CPU_CLK_UNHALTED.REF_TSC:sa=1000000:OS=no INST_RETIRED.ANY:sa=100000:OS=no INST_RETIRED.PREC_DIST:sa=100000:OS=no:pdir CPU_CLK_UNHALTED.REF_XCLK:sa=50000:OS=no CPU_CLK_UNHALTED.ONE_THREAD_ACTIVE:sa=1000000:OS=no CPU_CLK_UNHALTED.THREAD_P:sa=1000000:OS=no UOPS_RETIRED.RETIRE_SLOTS:sa=1000000:OS=no:pdir FP_ARITH_INST_RETIRED.SCALAR_SINGLE:sa=100000:OS=no:pdir FP_ARITH_INST_RETIRED.128B_PACKED_SINGLE:sa=100000:OS=no:pdir FP_ARITH_INST_RETIRED.256B_PACKED_SINGLE:sa=100000:OS=no:pdir FP_ARITH_INST_RETIRED.SCALAR_DOUBLE:sa=100000:OS=no:pdir FP_ARITH_INST_RETIRED.128B_PACKED_DOUBLE:sa=100000:OS=no:pdir FP_ARITH_INST_RETIRED.256B_PACKED_DOUBLE:sa=100000:OS=no:pdir UOPS_EXECUTED.X87:sa=100000:OS=no:pdir UOPS_EXECUTED.THREAD:sa=100000:OS=no FP_ARITH_INST_RETIRED.512B_PACKED_DOUBLE:sa=100000:OS=no:pdir FP_ARITH_INST_RETIRED.512B_PACKED_SINGLE:sa=100000:OS=no:pdir -knob enable-stack-collection=true -knob stack-size=0 -knob sampling-interval=0.01 -data-limit=5000
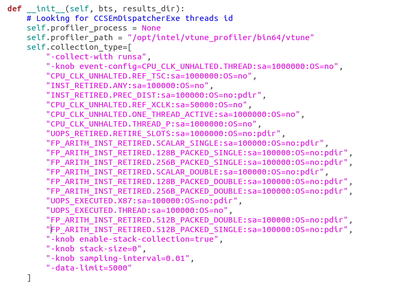
Here is the content of python script used to launch vtune.
I attached aforementioned sep,perfcmd and map files.
Thank you for your help
--Bernard
- Mark as New
- Bookmark
- Subscribe
- Mute
- Subscribe to RSS Feed
- Permalink
- Report Inappropriate Content
You can adjust "Event mode" knob in the custom analysis configuration setting it to USER. In the command line -knob event-mode=user can be used to count events in user space only.
-Alexei
Link Copied
- Mark as New
- Bookmark
- Subscribe
- Mute
- Subscribe to RSS Feed
- Permalink
- Report Inappropriate Content
Hi, Bernard.
there is mistake in your python script. You splitted events row but it must be as one line.
'-knob event-config=EVENT1,EVENT2,....EVENTN'
Kirill
- Mark as New
- Bookmark
- Subscribe
- Mute
- Subscribe to RSS Feed
- Permalink
- Report Inappropriate Content
Hi Kirill,
The script was written by someone else, I only added the custom events.
Will ordering the events in single line fix the issues described in my question?
Best regards,
--Bernard
- Mark as New
- Bookmark
- Subscribe
- Mute
- Subscribe to RSS Feed
- Permalink
- Report Inappropriate Content
Hi Kirill,
I quickly rearranged the events into the single line and got the same result as the previous one. Only two events are collected and their modifiers are the default one.
I do not know if this is the issue of the script (I'm not a Python programmer).
Thanks in advance.
- Mark as New
- Bookmark
- Subscribe
- Mute
- Subscribe to RSS Feed
- Permalink
- Report Inappropriate Content
Could you share how the scripts looks now? Full line must be in one pair quotes
- Tags:
- Could you
- Mark as New
- Bookmark
- Subscribe
- Mute
- Subscribe to RSS Feed
- Permalink
- Report Inappropriate Content
I'm not in front of my development machine now.
In regards to your question -- the full line was not inside of the single quotes pair. Tomorrow I will correct it and rerun the test. I hope, that correct modifiers will be passed to perf. I will keep you informed.
Thank you.
- Mark as New
- Bookmark
- Subscribe
- Mute
- Subscribe to RSS Feed
- Permalink
- Report Inappropriate Content
Hi Bernard,
Support of custom event modifiers for driverless Perf based collection is currently limited. However collection of events in user space only should work. pdir modifier is not yet supported.
perfcmd file is generated just for the reference so a user could copy, paste, modify and then collect perf data using system Perf tool and then import collected data file into VTune GUI for further analysis.
-Alexei
- Mark as New
- Bookmark
- Subscribe
- Mute
- Subscribe to RSS Feed
- Permalink
- Report Inappropriate Content
Hi Alexey,
Thank you for your response.
In regards to support of "sep" event modifiers (in the driverless mode) I came also to the same conclusion while seeing this perfcmd file:
Currently I'm not interested in mapping the events to their machine code instruction triggers, so I would like to skip over "pdir" modifier. The real problem now is the way to enforce only user mode counting because kernel mode count pollutes the results (out code runs in user mode address space).
>>>However collection of events in user space only should work.>>>
Is there any possibility to enforce the "u" modifier in driverless mode? I can not use SEP driver now and our script calls vtune to profile the test module.
Best regards
--Bernard
- Mark as New
- Bookmark
- Subscribe
- Mute
- Subscribe to RSS Feed
- Permalink
- Report Inappropriate Content
You can adjust "Event mode" knob in the custom analysis configuration setting it to USER. In the command line -knob event-mode=user can be used to count events in user space only.
-Alexei
- Mark as New
- Bookmark
- Subscribe
- Mute
- Subscribe to RSS Feed
- Permalink
- Report Inappropriate Content
Hi Alexey
Thank you for the help
Regards,
--Bernard
- Mark as New
- Bookmark
- Subscribe
- Mute
- Subscribe to RSS Feed
- Permalink
- Report Inappropriate Content
Hi,
Thanks for the confirmation. We would discontinue monitoring this issue.Please raise a new thread if you have further issues.
- Subscribe to RSS Feed
- Mark Topic as New
- Mark Topic as Read
- Float this Topic for Current User
- Bookmark
- Subscribe
- Printer Friendly Page

