- Mark as New
- Bookmark
- Subscribe
- Mute
- Subscribe to RSS Feed
- Permalink
- Report Inappropriate Content
VTune version: 2024.0.0.49502
Visual Studio 2019 Community
Windows 10 Professional 19045.3758
# "C:\Program Files (x86)\Intel\oneAPI\vtune\2024.0\bin64\amplxe-sepreg.exe" -c
Checking platform...
Platform is genuine Intel: OK
Platform has SSE2: OK
Platform architecture: INTEL64
User has admin rights: OK
Drivers will be installed to C:\Windows\System32\Drivers\
Checking sepdrv5 driver path...OK
Checking sepdrv5 service...
Driver status: the sepdrv5 service is running
Checking sepdal driver path...OK
Checking sepdal service...
Driver status: the sepdal service is running
Checking socperf3 driver path...OK
Checking socperf3 service...
Driver status: the socperf3 service is running
Checking vtss driver path...OK
Checking vtss service...OK
# "C:\Program Files (x86)\Intel\oneAPI\vtune\2024.0\bin64\amplxe-sepreg.exe" -s
Checking sepdrv5 driver path...OK
Checking sepdrv5 service...
Driver status: the sepdrv5 service is running
Checking sepdal driver path...OK
Checking sepdal service...
Driver status: the sepdal service is running
Checking socperf3 driver path...OK
Checking socperf3 service...
Driver status: the socperf3 service is running
Checking vtss driver path...OK
Checking vtss service...OKCould you please help diagnose? Thanks a lot!
- Mark as New
- Bookmark
- Subscribe
- Mute
- Subscribe to RSS Feed
- Permalink
- Report Inappropriate Content
Hi,
I see your working path includes ® and ™ special characters, can you remove them and then capture again? Thanks.
INTEL_MRTE_DATA_DIR=E:\workspace\playground\TestVTune\TestVTune\Intel® VTune™ Profiler Results\TestVTune\r007hs\data.0
Link Copied
- Mark as New
- Bookmark
- Subscribe
- Mute
- Subscribe to RSS Feed
- Permalink
- Report Inappropriate Content
Hi,
Thanks for posting in Intel Communities.
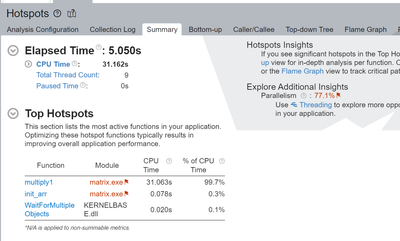
We tried running Hotspot analysis using Intel VTune on matrix multiplication sample and did not observe the issue reported by you. (See attached screenshot)
To assist you better and to replicate the issue from our side, kindly get back to us with the following information
- Sample reproducer code along with the exact steps/commands that you used to reach to the issue.
Thanks
- Mark as New
- Bookmark
- Subscribe
- Mute
- Subscribe to RSS Feed
- Permalink
- Report Inappropriate Content
Hi Rahila,
Thanks a lot for your help.
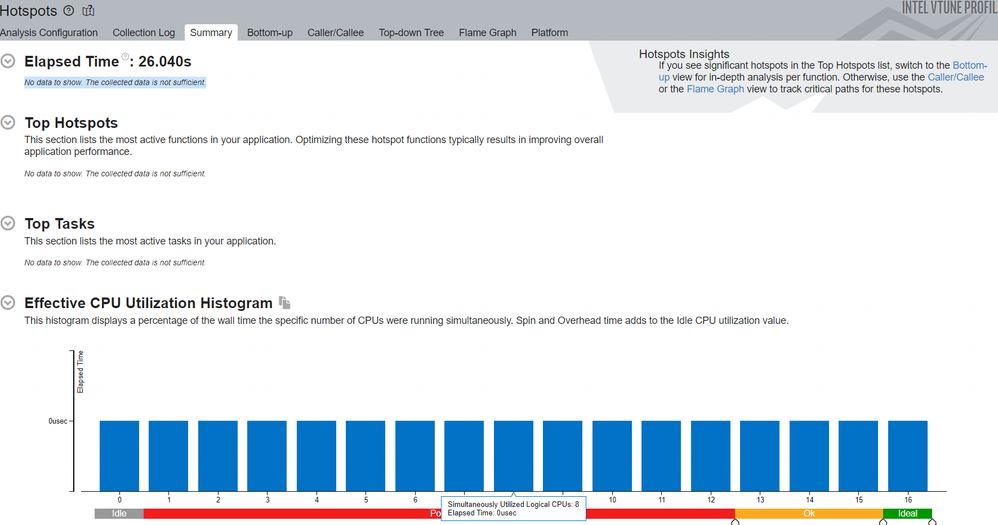
I tried to use the provided sample matrix executable at C:\Program Files (x86)\Intel\oneAPI\vtune\2024.0\samples\en\C++\matrix\matrix.exe, but I was not able to get data. Please check the attached video for my steps.
I think there's probably something wrong with my system but I don't know how to diagnose or fix. I tried uninstalling VTune and reinstalling but no luck.
I also tried to get an older version of VTune but I didn't subscribe so I could not find one from my registry center.
Thanks!
- Mark as New
- Bookmark
- Subscribe
- Mute
- Subscribe to RSS Feed
- Permalink
- Report Inappropriate Content
Hi Rahila,
I also run the vtune-self-checker.bat and there seems to be some error:
# "C:\Program Files (x86)\Intel\oneAPI\vtune\2024.0\bin64\vtune-self-checker.bat"
Intel(R) VTune(TM) Profiler Self Check Utility
Copyright (C) 2009 Intel Corporation. All rights reserved.
Build Number: 626834

HW event-based analysis (counting mode) (Intel driver)
Example of analysis types: Performance Snapshot
    Collection: Ok
    Finalization: Ok...
vtune: Error: Error 0x4000002a (Database interface error) -- Cannot run data transformation `Conditional GPU metric'.

    Report: Ok

Instrumentation based analysis check
Example of analysis types: Hotspots and Threading with user-mode sampling
    Collection: Ok
    Finalization: Ok...
    Report: Ok

HW event-based analysis check (Intel driver)
Example of analysis types: Hotspots with HW event-based sampling, HPC Performance Characterization, etc.
    Collection: Ok
    Finalization: Ok...
    Report: Ok

HW event-based analysis check (Intel driver)
Example of analysis types: Microarchitecture Exploration
    Collection: Ok
    Finalization: Ok...
    Report: Ok

HW event-based analysis with uncore events (Intel driver)
Example of analysis types: Memory Access
    Collection: Ok
    Finalization: Ok...
    Report: Ok

HW event-based analysis with stacks (Intel driver)
Example of analysis types: Hotspots with HW event-based sampling and call stacks
    Collection: Ok
    Finalization: Ok...
    Report: Ok

HW event-based analysis with context switches (Intel driver)
Example of analysis types: Threading with HW event-based sampling
    Collection: Ok
    Finalization: Ok...
    Report: Ok

Exception in thread Thread-48:prerequisite for GPU analyses...
Traceback (most recent call last):
  File "build\build_release_win32-x86_64_icx_2023.0.0_mstools_17.0\python.sitelib\sitelib\threading.py", line 980, in _bootstrap_inner
  File "build\build_release_win32-x86_64_icx_2023.0.0_mstools_17.0\python.sitelib\sitelib\threading.py", line 917, in run
  File "build\build_release_win32-x86_64_icx_2023.0.0_mstools_17.0\python.sitelib\sitelib\subprocess.py", line 1479, in _readerthread
  File "build\build_release_win32-x86_64_icx_2023.0.0_mstools_17.0\python.sitelib\sitelib\codecs.py", line 322, in decode
UnicodeDecodeError: 'utf-8' codec can't decode byte 0xd0 in position 0: invalid continuation byte
Checking DPC++ application as prerequisite for GPU analyses: Fail
Unable to run DPC++ application on GPU connected to this system. If you are using an Intel GPU and want to verify profiling support for DPC++ applications, check these requirements:
* Install Intel(R) GPU driver.
* Install Intel(R) Level Zero GPU runtime.
* Install Intel(R) oneAPI DPC++ Runtime and set the environment.

The system is ready to be used for performance analysis with Intel VTune Profiler.

The system is ready for the following analyses:
* Performance Snapshot
* Hotspots and Threading with user-mode sampling
* Hotspots with HW event-based sampling, HPC Performance Characterization, etc.
* Microarchitecture Exploration
* Memory Access
* Hotspots with HW event-based sampling and call stacks
* Threading with HW event-based sampling

The following analyses have failed on the system:
* GPU Compute/Media Hotspots (characterization mode)
* GPU Compute/Media Hotspots (source analysis mode)

Log location: C:\Users\Administrator\AppData\Local\Temp\vtune-tmp-Administrator\self-checker-2023.12.12_11.39.19\log.txt
Please help check whether it's relavant.
Thanks!
- Mark as New
- Bookmark
- Subscribe
- Mute
- Subscribe to RSS Feed
- Permalink
- Report Inappropriate Content
Hi,
Good day to you.
Could you please try to turn off the anti virus and run the same. If the issue still persist, share the Processor details so that we can investigate the issue further.
Thanks
- Mark as New
- Bookmark
- Subscribe
- Mute
- Subscribe to RSS Feed
- Permalink
- Report Inappropriate Content
Hi,
We haven't heard back from you.
Could you please provide an update?
Thanks
- Mark as New
- Bookmark
- Subscribe
- Mute
- Subscribe to RSS Feed
- Permalink
- Report Inappropriate Content
Hi Rahila,
Sorry for the delay.
I'm using the computer at work so I need to get permission from IT to turn off the anti-virus.
I'll come back later.
Thanks a lot!
Best,
Tianqian
- Mark as New
- Bookmark
- Subscribe
- Mute
- Subscribe to RSS Feed
- Permalink
- Report Inappropriate Content
Hi,
Thanks for your updates.
Please let us know the result once you are able to turn off the anti virus and run the same.
Thanks
- Mark as New
- Bookmark
- Subscribe
- Mute
- Subscribe to RSS Feed
- Permalink
- Report Inappropriate Content
Hi Rahila,
IT helped to turn off my anti-virus but the problem persisted. vTune still reported "The collected data is not sufficient."
My processor is Intel(R) Core(TM) i7-10700 CPU @ 2.90GHz. Please check the attached file for my detailed hardware infomation.
Thanks a lot!
Best,
- Mark as New
- Bookmark
- Subscribe
- Mute
- Subscribe to RSS Feed
- Permalink
- Report Inappropriate Content
Hi,
Thank you for the update. We are checking on this internally.
Thanks
- Mark as New
- Bookmark
- Subscribe
- Mute
- Subscribe to RSS Feed
- Permalink
- Report Inappropriate Content
Did you try with hotspots profiling with hardware event-base sampling using matrix sample? The same issue is observed?
- Mark as New
- Bookmark
- Subscribe
- Mute
- Subscribe to RSS Feed
- Permalink
- Report Inappropriate Content
Hi,
Yes I tried. The same issue was observed.
Please check the attached video for my steps.
Thanks a lot!
- Mark as New
- Bookmark
- Subscribe
- Mute
- Subscribe to RSS Feed
- Permalink
- Report Inappropriate Content
Please upload vtune data if possible, let me check. BTW, did you run VTune from VS?
- Mark as New
- Bookmark
- Subscribe
- Mute
- Subscribe to RSS Feed
- Permalink
- Report Inappropriate Content
- Mark as New
- Bookmark
- Subscribe
- Mute
- Subscribe to RSS Feed
- Permalink
- Report Inappropriate Content
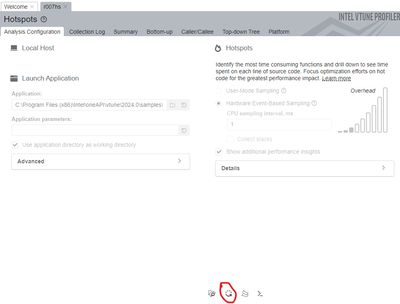
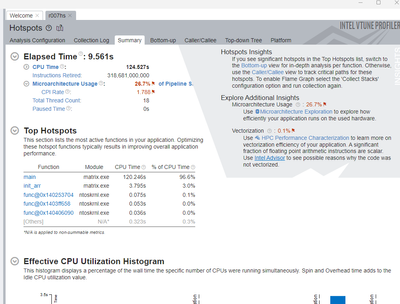
When i open your data, there is really no result display like you mentioned, then I re-resolve your data, like below,
It looks the result is right, you can try.
- Mark as New
- Bookmark
- Subscribe
- Mute
- Subscribe to RSS Feed
- Permalink
- Report Inappropriate Content
Hi,
I tried the same but the result did not show for me.
Don't known what went wrong here.
Please check the attached video for my steps.
Thanks!
- Mark as New
- Bookmark
- Subscribe
- Mute
- Subscribe to RSS Feed
- Permalink
- Report Inappropriate Content
It looks the collection is completed, but finalization failed in you local environment, can you do the same steps on other machine with Ubuntu? I've also tried using the same CPU as you and Ubuntu 20.04 and everything works. Not sure if there are some restrictions in your environment.
- Mark as New
- Bookmark
- Subscribe
- Mute
- Subscribe to RSS Feed
- Permalink
- Report Inappropriate Content
Hi,
Thanks I'll try it.
I don't have a Ubuntu desktop at hand, do you think WSL will work?
- Mark as New
- Bookmark
- Subscribe
- Mute
- Subscribe to RSS Feed
- Permalink
- Report Inappropriate Content
I am not sure, if all the dependencies are installed for VTune in WSL, maybe it can work.
- Mark as New
- Bookmark
- Subscribe
- Mute
- Subscribe to RSS Feed
- Permalink
- Report Inappropriate Content
Hi,
I installed vTune on Ubuntu 22 with Windows WSL2.
Re-resolving the saved profiling result file showed data!
Now I have a workaround. Thanks a lot!
Is there any other data I can provide so this issue could be further investigated and fixed?
Thanks!
- Mark as New
- Bookmark
- Subscribe
- Mute
- Subscribe to RSS Feed
- Permalink
- Report Inappropriate Content
I have discussed the issue with engineering team, the issue should be related to the local environment. I will provide an update when they respond, thanks.
- Subscribe to RSS Feed
- Mark Topic as New
- Mark Topic as Read
- Float this Topic for Current User
- Bookmark
- Subscribe
- Printer Friendly Page


