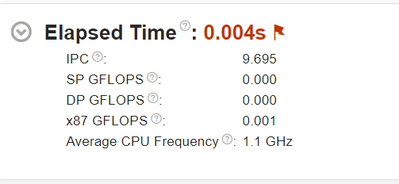
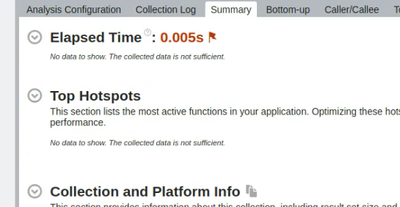
when I profiling my program without `-qopenmp`, it works properly. But when I use it, the elapsed Time become extremely low and wrong. However, when I use CUI to profile the same openMP program, it works properly.
the Analysis Configuration and Collection Log does not offer any warnings.
- 标记:
- VTune
链接已复制
Hi,
Thank you for posting in Intel Forums. We need the exact steps to reproduce so that we can debug further. Please provide the details of the OpenMP project you're currently working on. Also please provide us your VTune Profiler version and system information(OS & version)
Regards,
Alekhya
"Elapsed Time" count seems to be small. You may be advised to increase the workload. The sampling mode incurres and overhead and for very short program (less than milisecond) the results may be skewed.
What is the average workload of your program?
the duration of the program is about 480ms, but we also tested a 20seconds program. the problem repeat.
You may try to minimize the overhead by creating a custom analysis for a single [architectural] performance events e.g. CPU_CLK_UNHALTED.THREAD. Set the "sample after value" to 2000003 and enable only counting of user mode counter overflow code triggers. Disable any stack collection option.
sorry for being late, the notice email has been put into trash box automatically.
for the openMP project information :
we are optimizing it recently, and using vTune to profile. It's a image processing program which execution time has been optimized to 430ms.
recently, we have used vTune on other project, which occur the same problem while profiling multi thread omp program.(which has a longer executing time about 20seconds )
Vtune version and sys info :
host: windows 10 (windows 11 is the same) Intel oneAPI vTune Profier 2021.5.0
remote: ubuntu 18.04 Intel oneAPI vTune Profier 2021.5.0
Also:
due to the problem in remote profiling, we use Xmanager transfer remote GUI to local, and it work properly. So this problem seems only happen using remote ssh profile.
we also notice that the remote ssh profile could not automatically trace the source code of the profiling program (used -g flag when compiling )
I also tried advanced option duration time but the problem still.
Hello,
It looks like the application that is run through VTune remote flow could not load OpenMP runtime. If so - one option is to create a wrapper script on the target that sources needed vars etc. and then invokes the application. And put this wrapper script as an application to launch for VTune remote collection.
Thanks & Regards, Dmitry
did you mean .sh script, we have used it but that seems doesn't work
Hello, yes, I meant a kind of .sh script. Could you please redirect the output from the application run inside the script to a file and provide the output if it emitted by the app? It still looks like something was wrong at application startup.
Thanks & Regards, Dmitry
thank, you for your reply.
there are some reason I can't provide the output file, but I checked whether the app start up properly.
And yes, the application not start up, but vtune launched .
and the amplex-python on host doesn't output anything.
It used to display properly if the profile perform correctly

