- Mark as New
- Bookmark
- Subscribe
- Mute
- Subscribe to RSS Feed
- Permalink
- Report Inappropriate Content
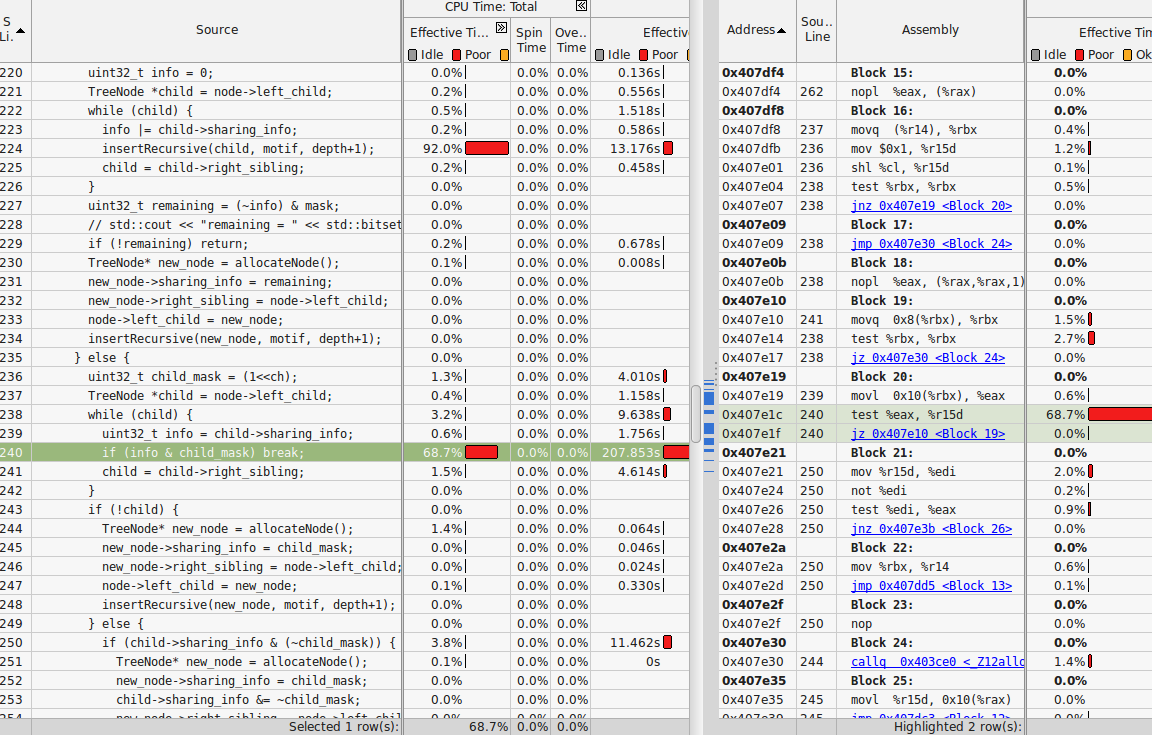
Can somebody please explain why the line in my code is taking so much time? Each tree node has two pointers (left child, right sigling) and a uint32 named shared_info. Please see the attached snapshot of vtune.
Link Copied
- Mark as New
- Bookmark
- Subscribe
- Mute
- Subscribe to RSS Feed
- Permalink
- Report Inappropriate Content
The culprit is likely movl instruction before the highlighted code.
From the release notes:
Running time is attributed to the next instruction (200108041)
o To collect the data about time-consuming running regions of the target, the VTune™ Amplifier XE interrupts executing target threads and attributes the time to the context IP address.
o Due to the collection mechanism, the captured IP address points to an instruction AFTER the one that is actually consuming most of the time. This leads to the running time being attributed to the next instruction (or, rarely to one of the subsequent instructions) in the Assembly view. In rare cases, this can also lead to wrong attribution of running time in the source - the time may be erroneously attributed to the source line AFTER the actual hot line.
o In case the inline mode is ON and the program has small functions inlined at the hotspots, this can cause the running time to be attributed to a wrong function since the next instruction can belong to a different function in tightly inlined code.
- Mark as New
- Bookmark
- Subscribe
- Mute
- Subscribe to RSS Feed
- Permalink
- Report Inappropriate Content
I was guessing that the movl instruction is the culprit. Is there a way to know why this instruction is taking so much time? Is it due to cache misses? Is it possible to confirm using some VTune feature?
- Mark as New
- Bookmark
- Subscribe
- Mute
- Subscribe to RSS Feed
- Permalink
- Report Inappropriate Content
Hi:
To analyze micro-architectural issues, use the General Exploration analysis type and review the appropriate Tuning Guide. That is, you need to identify which micro-architecture you are running on to analyze the results.
BTW, "pointer chasing" causes a common problem with cache misses. Re-arranging your data so that it is in memory sequentially, even if just for this computation, can save a lot of time.
- Subscribe to RSS Feed
- Mark Topic as New
- Mark Topic as Read
- Float this Topic for Current User
- Bookmark
- Subscribe
- Printer Friendly Page