- Marquer comme nouveau
- Marquer
- S'abonner
- Sourdine
- S'abonner au fil RSS
- Surligner
- Imprimer
- Signaler un contenu inapproprié
Hi, everyone
Currently I'm using VTune analyzer in linux system to profiling java code.
I generated report by attaching it to the running process.
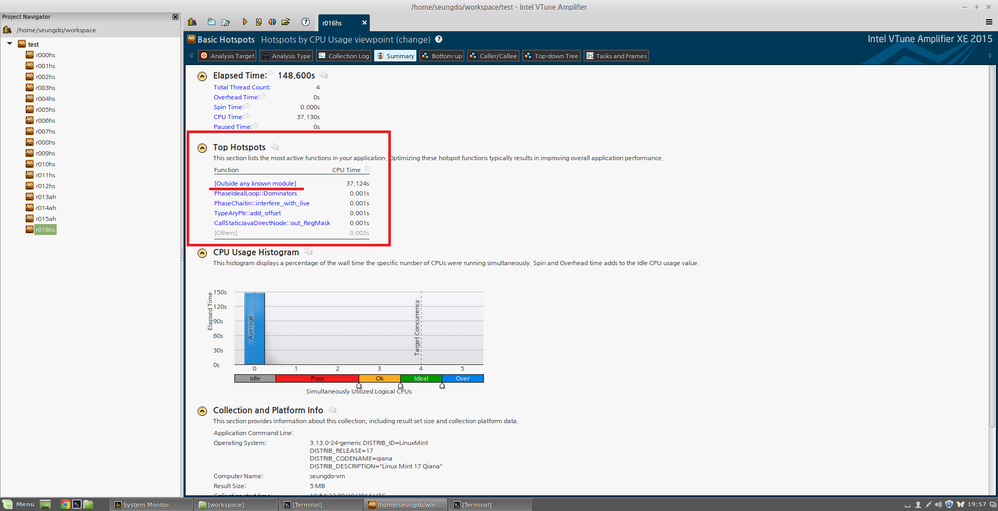
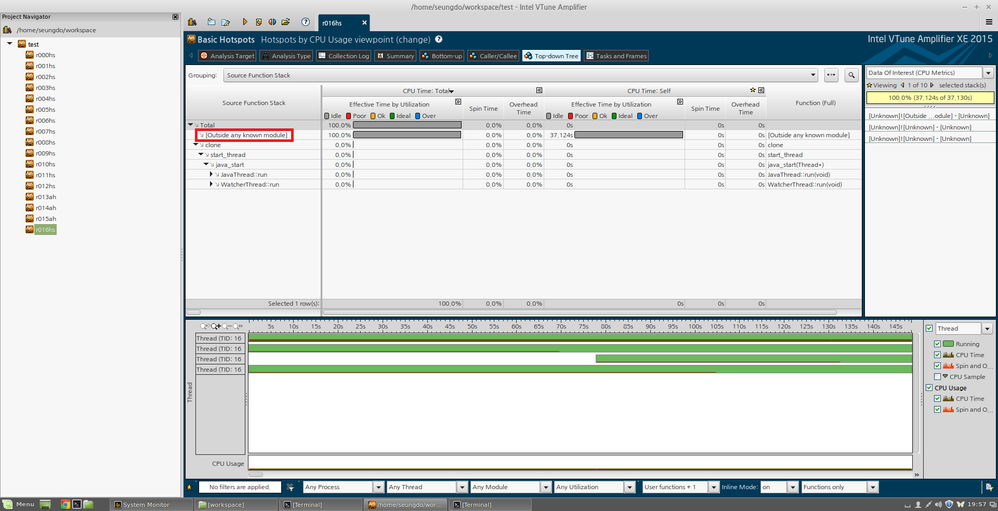
However, in top-down tree, I usually can see [Outside any known module] which took certain amount of time.
When I click it, I couldn't see any thing.
The strange thing is that sometime it can generate proper top-down report.
When vtune can generate proper report, trace file is usually about 500MB
On the other hands, when it can't generate, trace file is just about 5MB
There are plenty of opinion that it is because of "code on the fly".
So, I tried this steps after turning off the JIT option in jdk.
Ofcourse, I ran it under root.
But it doesn't work well.
My Ubutu version is 14.04.1 LTS
Please help me!!
Any kind of probable ideas may be helpful
Thanks
- Marquer comme nouveau
- Marquer
- S'abonner
- Sourdine
- S'abonner au fil RSS
- Surligner
- Imprimer
- Signaler un contenu inapproprié
So, two things I noticed:
- "-mrte-mode=native" - this limits collection to *native* code. You should omit this option so that managed code can be profiled.
- In reviewing release notes, I see that we added support for attaching to Java on Linux* for hardware-based sampling, only, in Update 4 of the 2013 release. Therefore, change your collect option to "-collect advanced-hotspots" and try again.
Hope that helps.
Lien copié
- Marquer comme nouveau
- Marquer
- S'abonner
- Sourdine
- S'abonner au fil RSS
- Surligner
- Imprimer
- Signaler un contenu inapproprié
Did you use supported JDK/JRE? Please see release notes. You need to use javac to build with "-g" option.
What is command line you used amplxe-cl? VTune Amplifier XE version?
- Marquer comme nouveau
- Marquer
- S'abonner
- Sourdine
- S'abonner au fil RSS
- Surligner
- Imprimer
- Signaler un contenu inapproprié
Thank you for replying my question.
1. Did you use supported JDK/JRE?
When I typed following command
=> java -version
It shows like following
=> java version "1.7.0_67"
Java(TM) SE Runtime Environment (build 1.7.0_67-b01)
Java HotSpot(TM) 64-Bit Server VM (build 24,65-b04, mixed mode)
2. javac to build with "-g" option.
When I compiled *.java file, I used command like following:
javac -g javatest.java
We are using VTune GUI in linux system.
The command that GUI make automatically is like following:
=> /opt/intel/vtune_amplifier_xe_2015.1.0.367959/bin64/amplxe-cl -collect hotspots -knob sampling-interval=1 -strategy=:trace:trace -mrte-mode=native --search-dir sym:p=/home/seungdo/workspace --target-process java
And the result is like following
Thank you for your help!!!!!!!!!!
- Marquer comme nouveau
- Marquer
- S'abonner
- Sourdine
- S'abonner au fil RSS
- Surligner
- Imprimer
- Signaler un contenu inapproprié
So, two things I noticed:
- "-mrte-mode=native" - this limits collection to *native* code. You should omit this option so that managed code can be profiled.
- In reviewing release notes, I see that we added support for attaching to Java on Linux* for hardware-based sampling, only, in Update 4 of the 2013 release. Therefore, change your collect option to "-collect advanced-hotspots" and try again.
Hope that helps.
- Marquer comme nouveau
- Marquer
- S'abonner
- Sourdine
- S'abonner au fil RSS
- Surligner
- Imprimer
- Signaler un contenu inapproprié
Thank you very much!!
But I have one more problem.
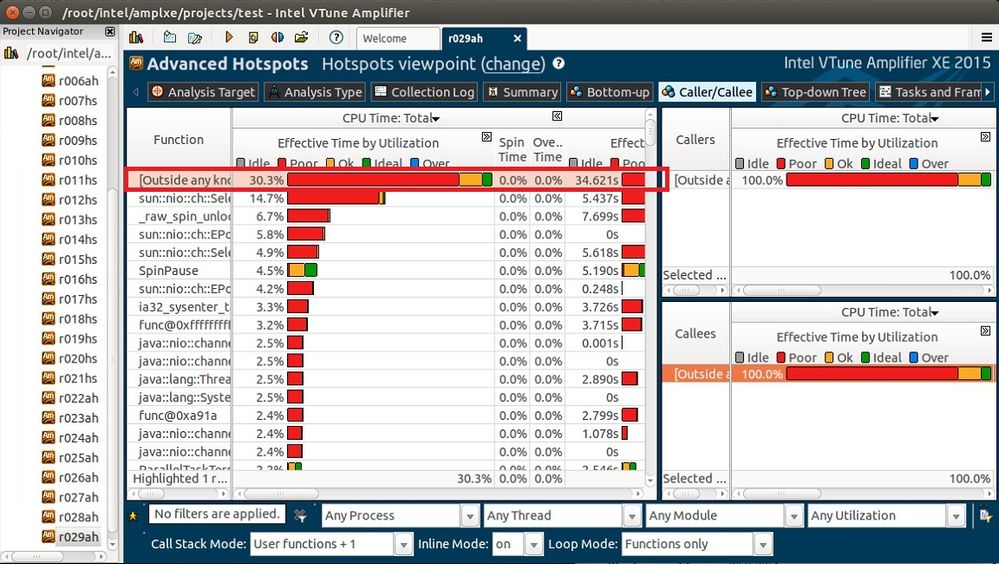
When I profiling with your advice, I have <unknown outside> message again like following
I think it is because that VTune cannot profile child process well.
When we profile, we are using attach to process method with PID information.
And when we profile with PID of child process that original process made or when we profile the process that doesn't make child process,
it could profile well without showing that error message.
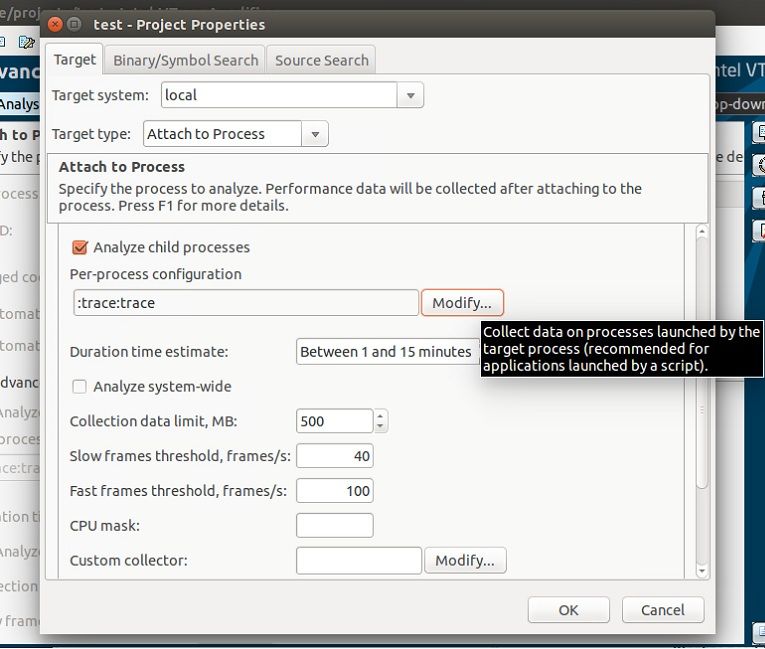
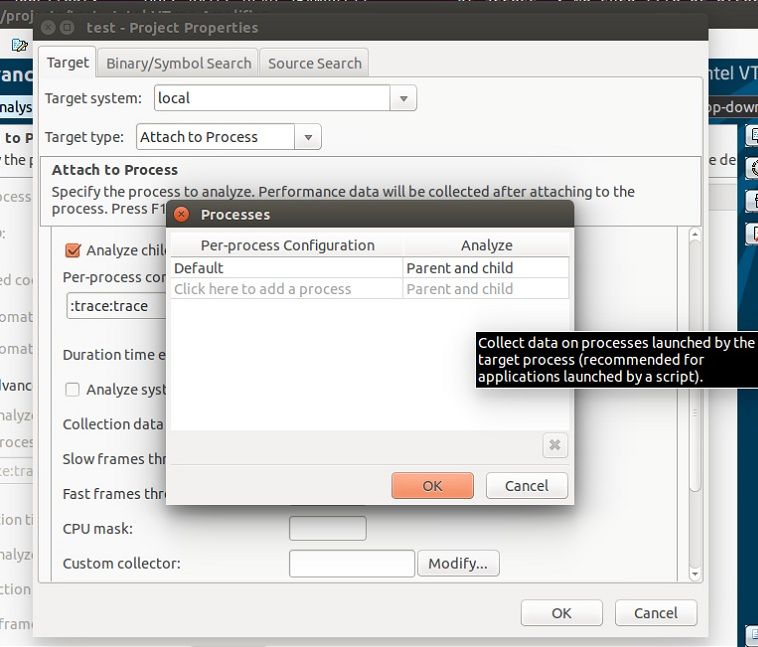
The project properties related to the child process profiling is like following:
Really appreciate for you help.
Best Regards
- Marquer comme nouveau
- Marquer
- S'abonner
- Sourdine
- S'abonner au fil RSS
- Surligner
- Imprimer
- Signaler un contenu inapproprié
To help your understanding I would like to add some more information about my problem
I guessed that maybe this <Unknown> problem is because of child process.
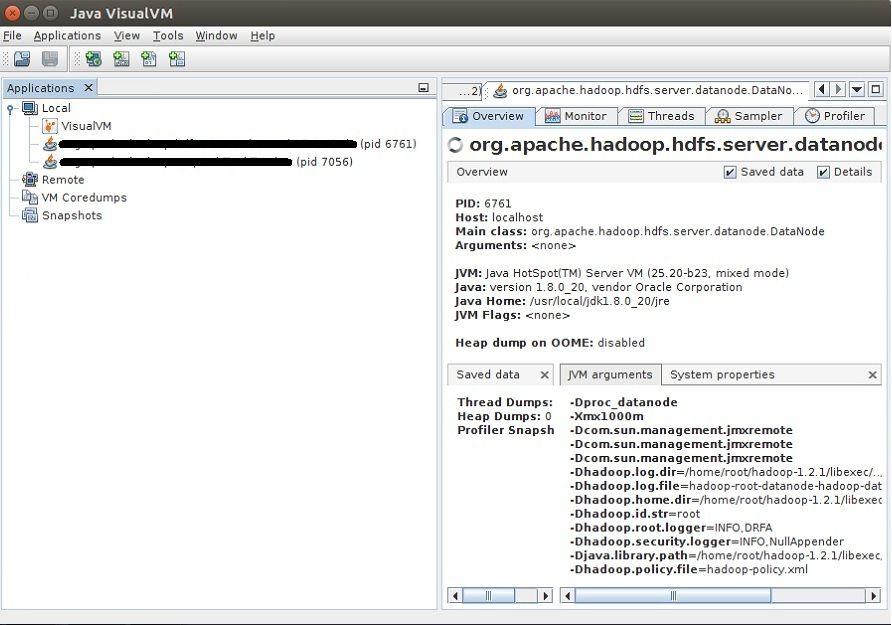
When I checked java process using Java VisualVM, it shows like following:
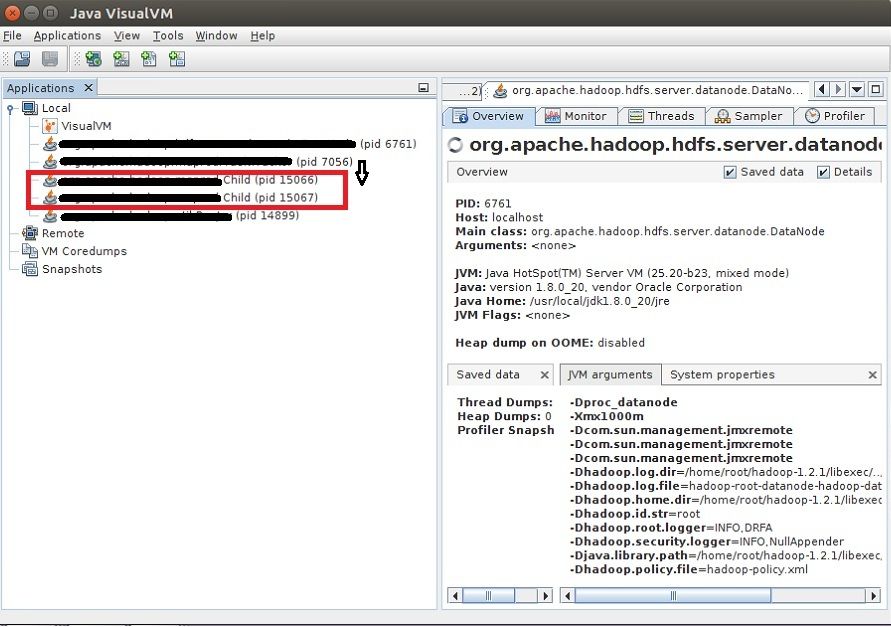
And when I give some job to daemon process (PID 7056), it generate child process like following:
I am sure that <unknown> error is because of this child process
Thank you for your help!
- Marquer comme nouveau
- Marquer
- S'abonner
- Sourdine
- S'abonner au fil RSS
- Surligner
- Imprimer
- Signaler un contenu inapproprié
>>> am sure that <unknown> error is because of this child process
Thank you for your help!>>>
Can VTune resolve parent proces? In your case proces PID 7056.
- Marquer comme nouveau
- Marquer
- S'abonner
- Sourdine
- S'abonner au fil RSS
- Surligner
- Imprimer
- Signaler un contenu inapproprié
@Youngil:
I think the problem is that when you attach to a process, any child processes already created by that process are unknown to the VTune Amplifier. VTune Amplifier inserts hooks to recognize when a new process is created, but because they were already created *prior* to VTune Amplifier attaching the process, it has no way of knowing about the child processes.
Are you trying to profile a Java app started by Apache? A technique we used many years ago was to modify the script that Apache uses to start the Java app and insert the VTune Amplifier command line, so that Apache starts VTune Amplifier and VTune Amplifier starts your Java app. That way, VTune Amplifier will know all about your application, including child processes. ;) And, if you don't want to collect all that profiling data about your app's start up, use the -start-paused option and enabling profiling once you are ready.
- Marquer comme nouveau
- Marquer
- S'abonner
- Sourdine
- S'abonner au fil RSS
- Surligner
- Imprimer
- Signaler un contenu inapproprié
- Marquer comme nouveau
- Marquer
- S'abonner
- Sourdine
- S'abonner au fil RSS
- Surligner
- Imprimer
- Signaler un contenu inapproprié
Check this page:
https://software.intel.com/en-us/vtune-help-enabling-linux-kernel-analysis
Make sure you set this before running the trace:
sysctl -w kernel.kptr_restrict=0
- S'abonner au fil RSS
- Marquer le sujet comme nouveau
- Marquer le sujet comme lu
- Placer ce Sujet en tête de liste pour l'utilisateur actuel
- Marquer
- S'abonner
- Page imprimable
