Hello,
I'm optimising a multi-threaded application for a Xeon E5-2680 (2 sockets, 8 physical cores per socket). Threads are bound to cores through affinity, thread 0-7 to cores 0-7 in socket 0, then thread 8-15 to cores 8-15 in socket 1. What happens is that performance scale linearly up to 8 threads, i.e. when the application is confined to a socket (or NUMA node). With more than 8 threads, the application performance have very variable execution times.
I suspect that it has to do with the inefficient remote memory access. How can I confirm that with Vtune? Is there a way to count the number of remote memory accesses? Which analysis should carry on?
Thanks
链接已复制
There is no IMC_* events to track memory traffic over cores/sockets, but for Sandy/Ivy Bridge processors you can use below events.
OFFCORE_RESPONSE.ANY_REQUEST.LLC_MISS_LOCAL.DRAM_0
OFFCORE_RESPONSE.ANY_REQUEST.LLC_MISS_LOCAL.DRAM_1
Thanks, Peter
You can select "Bandwidth" analysis to profile your application. Can't you?
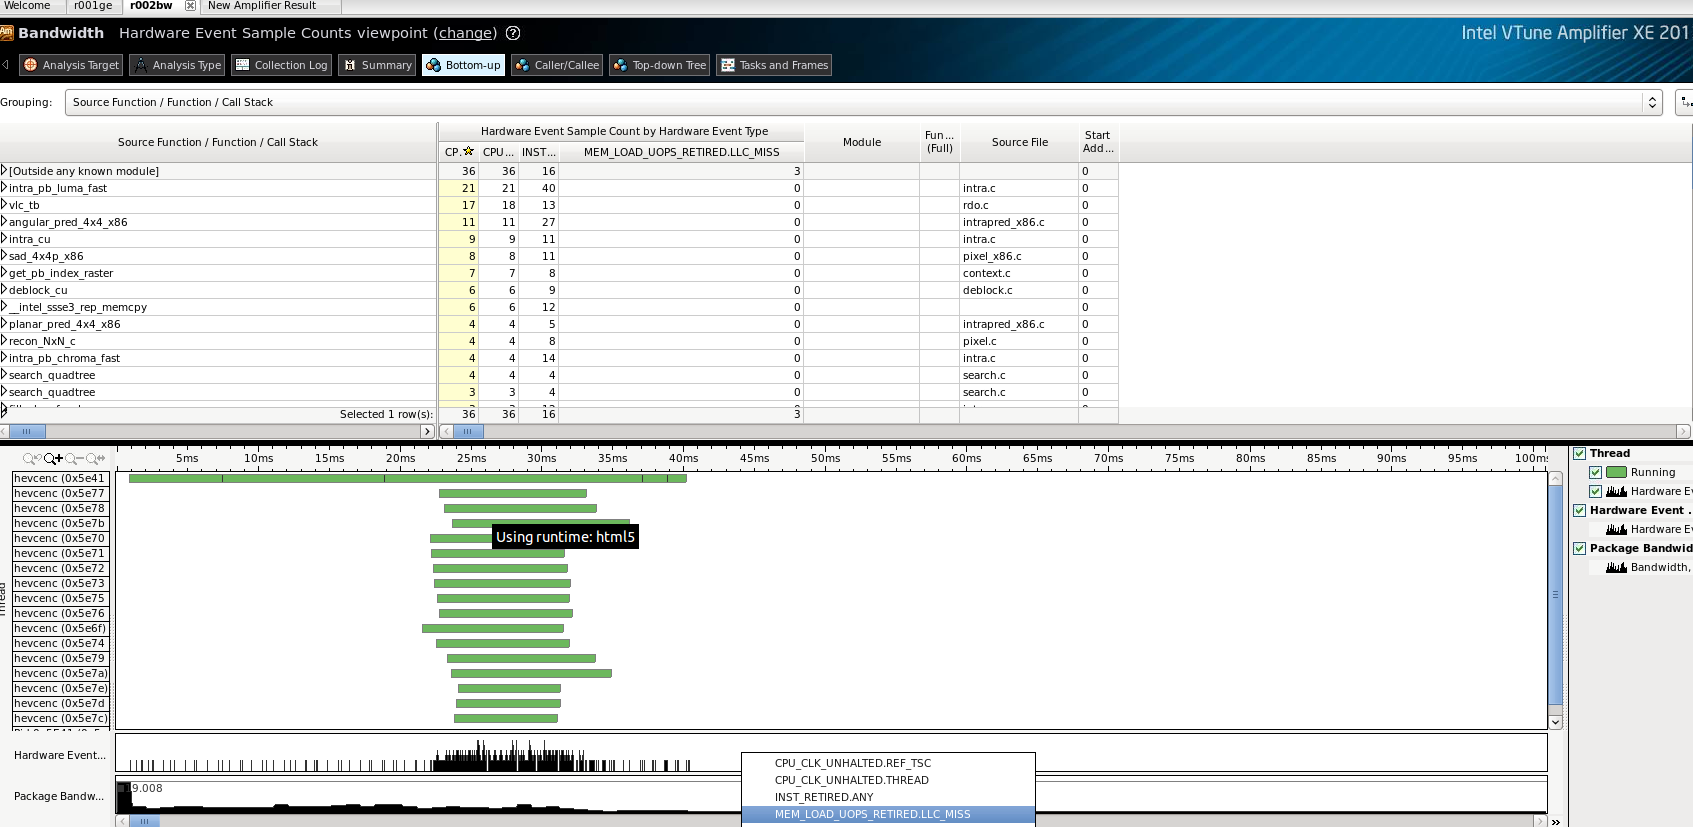
After data collecting...You can change "viewpoint" as "Hardware Event Sample Counts" in Bottom-up report. You can see events count on all functions, also you can change "Grouping" to "Core / Thread / Function / Call Stack" to know each core which has workload of threads.
(I will get back to you tomorrow, now it's 11:30pm in APAC time. Sorry)
Thanks Peter for your explanation.
I have attached some screenshots for the Bandwidth and General Exploration analysis for Sandy Bridge architectures. As far as I can see, the Bandwidth analysis doesn't collect offcore events, whilst the General Exploration analysis collects some. I haven't found those mentioned in your first post (OFFCORE_RESPONSE.ANY_REQUEST.LLC_MISS_LOCAL.DRAM_*). Also the General Exploration, in the Hardware issues viewpoint, reports "LLC load misses serviced by remote DRAM". Those are all the events count I can get from Vtune. Am I right?
Stefano C. wrote:
I'm using VTune Amplifier XE 2013 Update 12, Linux version. Bandwidth analysis for Sandy Bridge/ Ivy Bridge / Hasweel. There are only few events I can check.
I cannot reproduce this problem, I used a simple test case which is a single thread app and there is no offcore LLC access/miss - but you still can see OFFCORE_* events (zero in count). See my screen-shot. Is it possible that you can right-click on showed event and select "Show All Columns" to change something?
For get performance improved in your multithreaded app, my opinion is to reduce of using variable(s) which was used in one thread (sometime LLC missed), but requested ACCESS from other thread(s). You may do: 1) Reduce these variables LLC miss in one thread, or 2) Use other variables in other threads to avoid OFFCORE remote access. 3) Split different variable use for different core. 4) Other you can image...
It seems that the only 4 events monitored are those listed in the bw.png screenshot I attached on Friday. Is that matching your "Analysis Type" tab? Perhaps, I'm missing some features/drivers? Clicking on "Show all Data" didn't showed any hidden columns.
In Help->About, Details tab, it says: Update 12 (build 305106).