- Mark as New
- Bookmark
- Subscribe
- Mute
- Subscribe to RSS Feed
- Permalink
- Report Inappropriate Content
My software is a multi-thread database server for OLTP.
I run a benchmark for the database, and profiling the database server with vtune profiler.
The benchmark will simulate 72 connections to database server and each connection run a simple query to database concurrently. Each query is about 100-200 bytes.
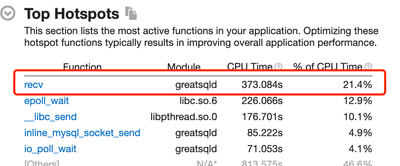
The hotspots for database server :
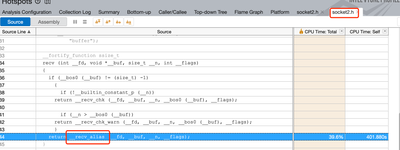
You will see recv function(linux socket standard recv function) cost too much time. so i want dig into recv to find the reason.
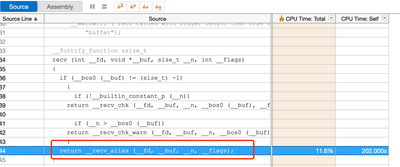
The source code can not go deeper.
The Caller/Callee can show some callees, but the CPU Time is negligible.
How can go deeper to analyze why recv take so much time?
Link Copied
- Mark as New
- Bookmark
- Subscribe
- Mute
- Subscribe to RSS Feed
- Permalink
- Report Inappropriate Content
Hi,
Thank you for posting in Intel Communities. Based on the screenshots you provided, we could see that recv function is calling another function __recv_alias_(…) which is taking 202.7 seconds of the CPU time. To check the same, you need to see the call stacks pane in the Bottom-up window.
We took a small C++ sample where main function calls another function fib() from another program file(cpp_fib.cpp). Let me explain in detail as follows:
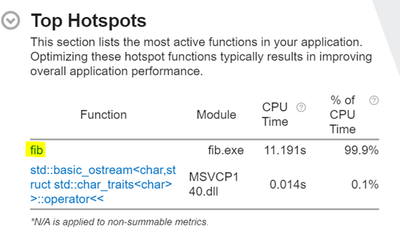
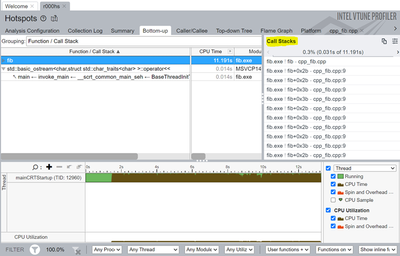
- In the Summary Window of Vtune Profiler, I clicked on fib function, which is highlighted, from the below screenshot and got navigated to the Bottom-up window.
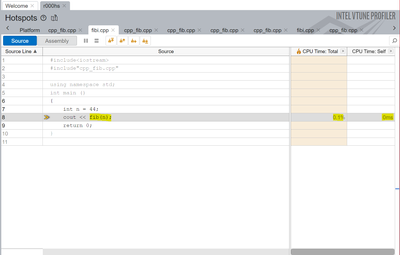
- In the bottom-up window, if you double click on any function/call stack in the left sided pane, you could see the source code. We double clicked on fib to see fib.cpp program's source code as follows:
Note: The above screenshot only has 0.1% as it takes some negligible amount of time to print the result from fib(n) function. So, to see the Total CPU time that the fib(n) took, including calling and executing, you need to view source code from the Call stacks pane. See the detailed explanation with screenshots as follows.
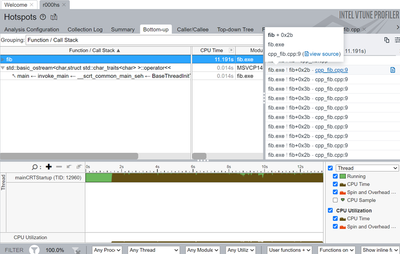
- In the bottom-up window, there’s a Call Stacks pane where you could hover over the .cpp files and you can view the source code of the functions you’ve called. The main() function in fib.cpp program is calling another function fib() which exists in cpp_fib.cpp program.
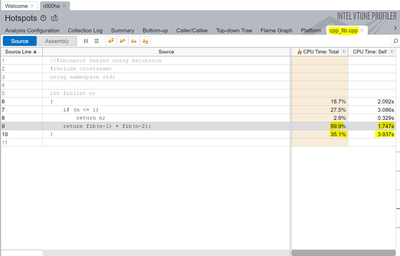
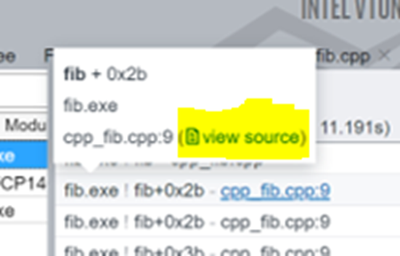
- By clicking on view source from the pop as shown above, You would be navigated to the cpp_fib.cpp source code where you could see the CPU time as follows:
- You could go back to the bottom-up pane to get any source code by hovering over each file in the Call Stacks Pane as follows:
Hope we are clear with all the details and result interpretations. If this resolves your issue, please accept this as a solution. This helps others with similar issue. Thank you!
Regards,
Alekhya
- Mark as New
- Bookmark
- Subscribe
- Mute
- Subscribe to RSS Feed
- Permalink
- Report Inappropriate Content
I can just go to the recv function in socket2.h source file which belongs to the system socket API ,
but I can not go inside__recv_alias_(…) function
- Mark as New
- Bookmark
- Subscribe
- Mute
- Subscribe to RSS Feed
- Permalink
- Report Inappropriate Content
Hi,
You would be able to find that recv_alias_..(...) function in the source code where it actually exists. socket2.h file has recv_alias..() function initialized?
Or could you please share your sample code file so that we can try reproducing your issue?
Regards,
Alekhya
- Mark as New
- Bookmark
- Subscribe
- Mute
- Subscribe to RSS Feed
- Permalink
- Report Inappropriate Content
Hi,
Could you please give us an update regarding this issue?
Regards,
Alekhya
- Mark as New
- Bookmark
- Subscribe
- Mute
- Subscribe to RSS Feed
- Permalink
- Report Inappropriate Content
Hi,
We assume that your issue is resolved. If you need any further assistance, please post a new question as this thread will no longer be monitored by Intel.
Regards,
Alekhya
- Subscribe to RSS Feed
- Mark Topic as New
- Mark Topic as Read
- Float this Topic for Current User
- Bookmark
- Subscribe
- Printer Friendly Page
