- Mark as New
- Bookmark
- Subscribe
- Mute
- Subscribe to RSS Feed
- Permalink
- Report Inappropriate Content
- using intel vtune amplifier 2018
- on CentOS Linux release 7.6.1810 (Core)
- basic hotspots analysis (cannot use advanced hotspots as the drivers are not installed)
- g++ (GCC) 5.3.0
- application is using openmp
- Intel(R) Xeon(R) CPU E5-2640 v3 @ 2.60GHz
- I don't have root permissions
- I cannot change anything of the data above
Questions:
- some function names are mangled making them fully unreadable -- how to avoid this?
- CPU time used is not displayed but instead "idle" & "poor". What does this mean? How can I see the CPU time used?
- stack depth is very limited . How to increase the stack depth?
- in general a lot of info is being displayed for which I don't even know the meaning. I would like some hierarchical display of what function calls which and how much CPU time is is used for a particular function with and without children and what is the percentage of CPU time contributed to this function called from which other function
Link Copied
- Mark as New
- Bookmark
- Subscribe
- Mute
- Subscribe to RSS Feed
- Permalink
- Report Inappropriate Content
Hi,
Thanks for posting in Intel Forums. We looked into your case. We have listed down possible solutions which you can try to resolve your issues,
- Can you attach some screenshots for your first issue ('some function names are mangled')
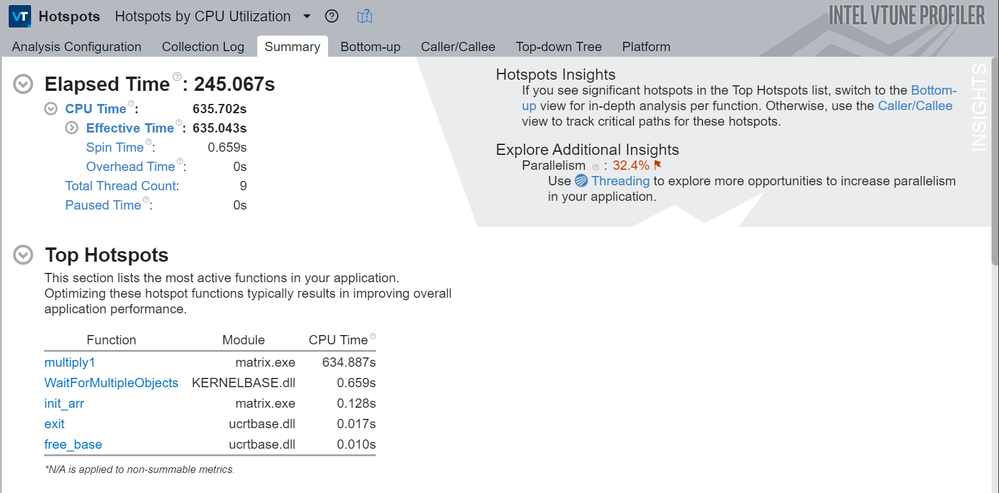
- for your second query, after opening VTune when clicking on 'Configure Analysis', just make sure you have selected 'Hotspot Analysis'. Then click on Configure Analysis, the analysis will take some time. After that reports will be generated in the VTune window. From the tab select 'Summary' there you can see CPU time used.
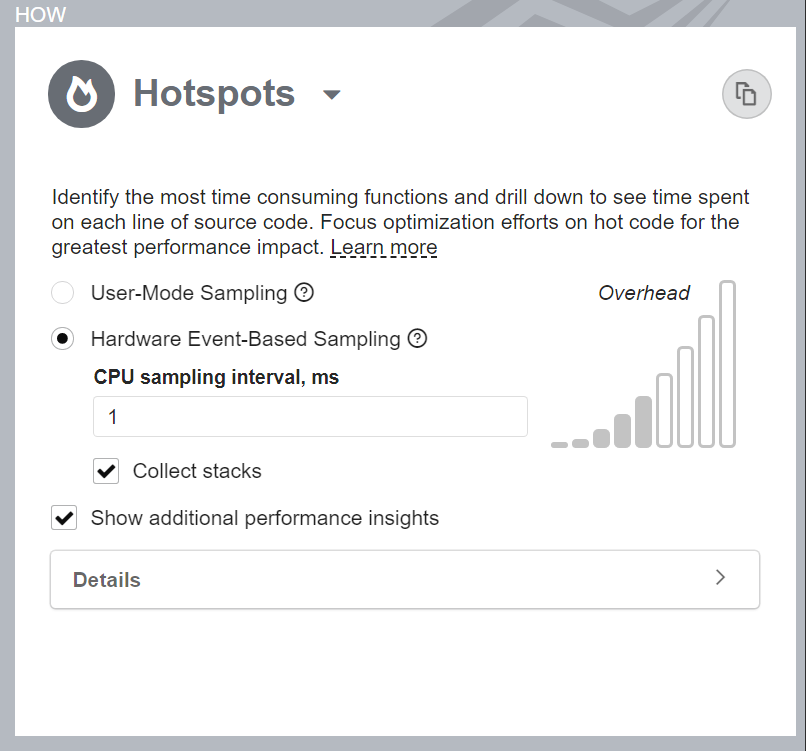
- For running Hardware event based sampling we need to run VTune as an administrator. After opening VTune from the 'HOW' pane, select 'Hotspot Analysis' and choose 'Hardware Event-Based Sampling' and also check the 'Collect Stacks' option
After doing the above steps you can follow the below mentioned steps to
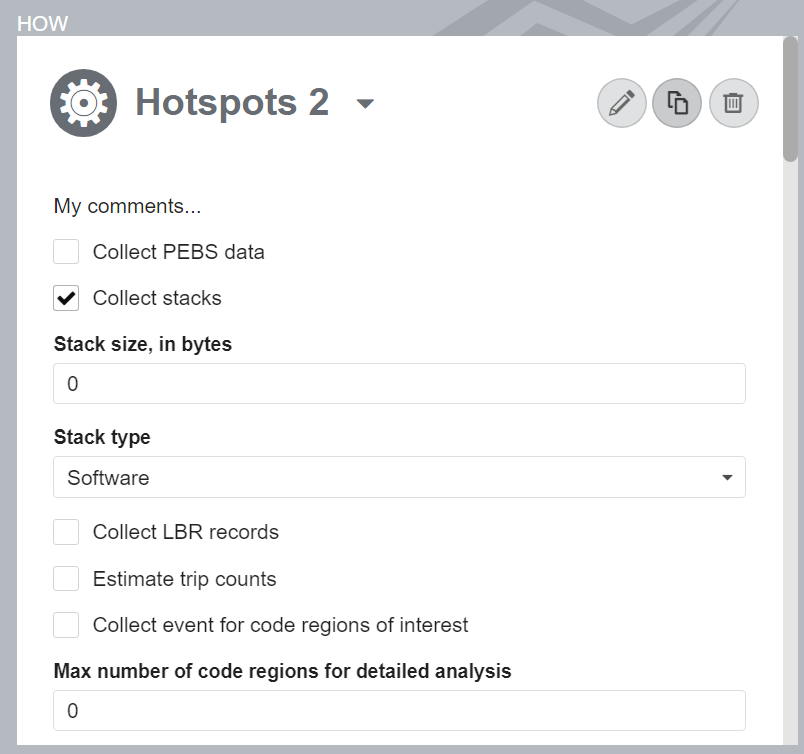
change the stack size
- In the 'HOW' pane at the extreme right there is a document icon, click on that icon
- After clicking on that icon you'll get a menu from where you can change the stack size and proceed to do the configure analysis.
I have attached corresponding screenshots which you can refer to if you have any doubts.
I have also attached some links from where you can learn about how to interpret the results of VTune analysis
Interpret Result Data


- Mark as New
- Bookmark
- Subscribe
- Mute
- Subscribe to RSS Feed
- Permalink
- Report Inappropriate Content
Hi,
We haven't heard back from you. Could you please confirm if your issue is resolved.
Regards,
Rahul
- Mark as New
- Bookmark
- Subscribe
- Mute
- Subscribe to RSS Feed
- Permalink
- Report Inappropriate Content
Hi,
I haven't heard back from you, so I will close this inquiry now. If you need further assistance, please post a new question.
Thanks and Regards
- Subscribe to RSS Feed
- Mark Topic as New
- Mark Topic as Read
- Float this Topic for Current User
- Bookmark
- Subscribe
- Printer Friendly Page