- Mark as New
- Bookmark
- Subscribe
- Mute
- Subscribe to RSS Feed
- Permalink
- Report Inappropriate Content
Hi Ravi,
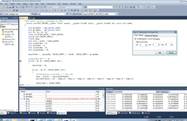
After applying this steps I reached the hotspots, we find hotspot on a function called ShowListView , On pressing the function to reach the code we find the clockticks = 1 and The Tuning Assistant doesnt support us with solution,
We want to know how the clockticks = 1 and the system refers that there is a hotspot !!
Also if there is a hotspot how we can resolve while Tuning Assistant doesnt support Us
What is the situation in case of dont find hotspots ?
Please find the following image for more declaration:
Thanks
Link Copied
- Mark as New
- Bookmark
- Subscribe
- Mute
- Subscribe to RSS Feed
- Permalink
- Report Inappropriate Content
- Mark as New
- Bookmark
- Subscribe
- Mute
- Subscribe to RSS Feed
- Permalink
- Report Inappropriate Content
Hi Ravi,
After applying this steps I reached the hotspots, we find hotspot on a function called ShowListView , On pressing the function to reach the code we find the clockticks = 1 and The Tuning Assistant doesnt support us with solution,
We want to know how the clockticks = 1 and the system refers that there is a hotspot !!
Also if there is a hotspot how we can resolve while Tuning Assistant doesnt support Us
What is the situation in case of dont find hotspots ?
Please find the following image for more declaration:
Thanks
Hi Sam:
It's not that the VTune analyzer is identifying this function as a Hotspot, it is just that you are drilling down from the Hotspot view. You can see in Clip3 (the Modules view) that usp10.dll had 12.17% of all the samples in it, while your JIT module only had 3 samples. Clearly, your JIT module is not of interest in these results. If the workload is representative of what the application will do, then the conclusion you can draw from the data is that your code is not contributing significantly to the total execution time. Instead, modules that your code is utilizing are actually consuming most of the time.
Your next step should be to run call graph on the app and try to determine what part of your code is using the modules/functions that are consuming most of the time. And, then, look for more efficient ways of accomplishing the same functionality.
- Subscribe to RSS Feed
- Mark Topic as New
- Mark Topic as Read
- Float this Topic for Current User
- Bookmark
- Subscribe
- Printer Friendly Page