Bug Chasing with the Simics® Simulator Running the Simics Simulator
By Evgenii Iuliugin and Jakob Engblom
“One factor that differentiates kernel development from user-space development is the hardship associated with debugging. It is difficult, relative to user-space, to debug the kernel.” – Robert Love, Linux Kernel Development, Third Edition.
This is story of a single line of code that took nine months to write. The story began in early 2020 with a couple of bug reports complaining about Windows* host crashes when running the Intel® Simics® Simulator. The reports indicated that the simulations were running on servers using the Microsoft* Windows* Server 2019 operating system. It appeared that similar hardware running Windows Server 2016 did not suffer problems. However, over time similar reports did start to appear for hosts running older Windows versions as well as Linux*.
Thus, it was clear that there was a rare but repeatable issue where running Simics virtual platforms caused system crashes. The crashes happened when the virtual platform used virtualization to speed up the execution of target system code. When replicating the conditions causing the bug in the development lab, the bug was found to trigger about once per day on average (with the Simics Simulator running non-stop on a dedicated replication host). Note that “on average” means that some days the crash could happen multiple times, other days not at all.
This is the story of what happened, and how the bug was found and resolved. The bug was in low-level code that is very hard to debug on hardware. However, debugging was possible by running the Simics Simulator on top of the Simics Simulator.
Accelerating Simics Simulation Using Virtualization
To explain what was going on, let us start with some background information. At core, the Simics Simulator runs target system instructions using a mix of an interpreter, a just-in-time (JIT) compiler, and virtualization. Virtualization is used when simulating Intel architecture targets on Intel architecture hosts, allowing simulations to run much faster than when using a JIT compiler.
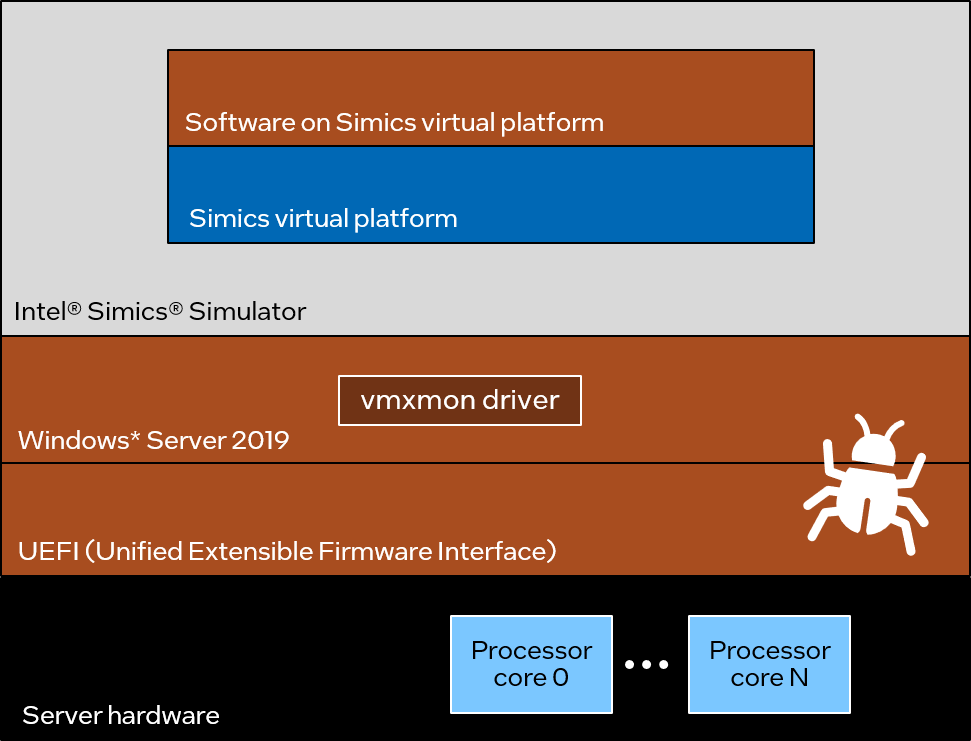
To use virtualization, the Simics simulator relies on a custom driver known as vmxmon, as shown in the following picture:
In effect, vmxmon works as a virtual machine monitor (VMM), similar to other hypervisor or virtual machine software vmxmon itself runs in what is known as VMX root mode–the hypervisor mode–while guest or target software (the code running on the simulated system) runs in VMX non-root mode.
The processor behavior in VMX non-root mode is restricted and modified to facilitate virtualization. Certain instructions and events cause virtual machine (VM) exits, transitioning back to the VMM. The VMM uses a virtual machine control structure (VMCS) to manage guest software running in VMX non-root mode. This allows the VMM to retain control of the host, even if the guest software is running operating-system code. See “Intel® 64 and IA-32 Architectures Software Developer’s Manual” for more details.
Counting Instructions
A key part of the vmxmon driver is the instruction counting mechanism. To maintain correct and deterministic simulation of a target system, it is necessary to know the number of instructions that were executed in each run in VMX non-root mode. Vmxmon also enforces an upper limit on the number of instructions that can be executed in VMX non-root mode, to ensure that the simulator core gets back control and can schedule other work.
Vmxmon uses the “Architectural Performance Monitoring” counter for instruction retired events. To limit the number of instructions executed in VMX non-root mode, the host Advanced Programmable Interrupt Controller (APIC) is configured to generate a non-maskable interrupt (NMI) when the instruction retired counter overflows. The NMI causes a VM-exit, passing control back to the simulator. If a VM-exit happens for some other reason, the performance counter is read to determine how many instructions were executed in VMX non-root mode.
Initial Investigation
When the bug was first encountered, the user provided a small Windows kernel memory dump that provided some limited information on the event. From the dump, it was clear that the vmxmon kernel driver was loaded. The Microsoft WinDbg debugger provided this information:
Loading Dump File [C:\Users\___\Downloads\vmxmon-debug\DUMPs\122319-10609-01.dmp]
Mini Kernel Dump File: Only registers and stack trace are available

17: kd> !analyze -v
*******************************************************************************
*                                                                             *
*                        Bugcheck Analysis                                    *
*                                                                             *
*******************************************************************************

CLOCK_WATCHDOG_TIMEOUT (101)
An expected clock interrupt was not received on a secondary processor in an
MP system within the allocated interval. This indicates that the specified
processor is hung and not processing interrupts.
Arguments:
Arg1: 0000000000000002, Clock interrupt time out interval in nominal clock ticks.
Arg2: 0000000000000000, 0.
Arg3: ffff908184e80180, The PRCB address of the hung processor.
Arg4: 0000000000000058, 0.
That is, the operating system detected that one of the processor cores had missed two clock interrupts. This is considered a fatal situation that crashes the operating system (known as a bug check in Windows). Since no more information could be gleaned from the small kernel dump, the crashing system was reconfigured to generate a full kernel crash dump with more information.
More Information
As expected, the Windows kernel crash dump did provide more information than the mini dump. The stack trace from the hanging processor pointed at the vmxmon driver code, specifically at the first instruction of the VM-exit handling code. From the dump, it appeared the processor core was stuck inside the vmxmon driver, and that the driver seemed to somehow prevent the processor from responding to the periodic Windows Clock Watchdog check.
The initial guess about the cause was that somehow the driver did not handle interrupt disabling correctly. As a result, interrupts would be disabled for extended periods of time, producing the observed hang. The driver has a few short time windows where interrupts are masked. In addition, when running in VMX non-root mode, external interrupts such as the clock interrupts are configured to cause VM-exits. This meant that at least in theory, an error in the vmxmon driver interrupt-handling code could be causing the crashes.
A thorough review of the vmxmon code determined that the interrupt handling was correct. The available kernel memory dumps indicated that the driver was involved. This contradiction could only be resolved by collecting more information and attacking the problem from a new angle.
A Wrinkle in the NMI
The Windows bug check code sends NMIs to all processors in the system in order to make the processors save their state to the crash dump. In this specific case, the processor first missed two clock interrupts. It was then supposed to receive an NMI to dump its state. The vmxmon driver also uses NMIs to cause VM-exits from target code. Did this somehow create a conflict? Would the problem be solved by not using NMIs in vmxmon at all?
Fortunately, there is an alternative configuration of vmxmon that uses external interrupts instead of NMIs to indicate that performance counter overflows. Using this mode removed the potential collision on NMI usage—but the crash still happened.
When inspecting the resulting kernel crash dumps, the debugger was unable to locate the stack trace for the hanging processor core. The stack used for NMIs was also empty, which indicated that the processor core never received the NMI for the bug check. The initial stack trace that showed the vmxmon driver as part of the NMI stack was just a left-over from the use of NMIs to force VM-exits in normal operation. It was a false lead, basically.
At this point, two facts were clear:
- The processor core did not respond to regular external interrupts or NMIs.
- The vmxmon interrupt handling was correct and did not block the processor from receiving interrupts.
What was the next step? Gather more information from a new angle!
Getting More Information
To get more information, the vmxmon driver was modified to save the contents of the VMCS structure, time stamp counter, and value of the CR8 register in three different places: before VM-entry, after VM-exit, and in the NMI handler callback. The kernel memory dump makes it possible to inspect the saved information, as well as structures describing state of the currently running virtual machines.
Rerunning the failures with these additions, it eventually became clear that neither the debug code for VM-exit nor that for NMIs were run before the system crashed. The situation thus looked like in the following picture. The code did a VM-enter, started running in VMX non-root mode, and then something happened that left the processor core hanging and not responding to interrupts.
Exploring Possible Causes
Based on these observations, it was possible to describe the sequence of events that occurred in the system before the hang (skipping some details to capture the most important steps):
- The Simics Simulator process running in user-mode calls the vmxmon driver to run some code using virtualization.
- The driver prepares the VMCS, configures the APIC to generate an interrupt on performance counter overflows, and other setup work.
- The driver enters VMX non-root mode and starts the execution of target software.
- The processor core stops responding to clock interrupts and NMIs.
The crucial observation here is that whatever is going on prevents the processor from responding even to NMIs. There aren’t many ways to do that, and one hypothesis was that the processor core was stuck in System Management Mode (SMM).
Testing for SMI
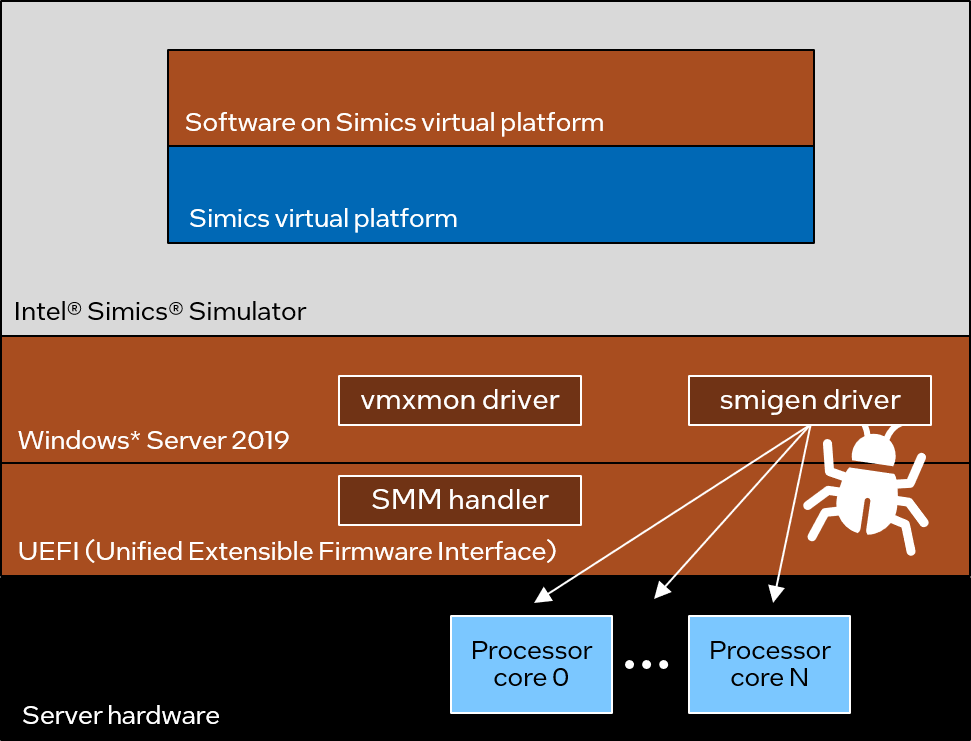
Testing this is not trivial, but fortunately there is the smigen tool. It broadcasts system management interrupts (SMI), forcing all processor cores to enter SMM. The tool was run when the Simics Simulator was running, as illustrated below:
The hunch that SMM could have something to do with the problem was validated when the host crashed just a short time after starting to use smidgen. This confirmed the hypothesis that SMM was involved. The sequence of events listed above can be extended with one more step, right before the hang:
- The Simics Simulator process running in user-mode calls the vmxmon driver to run some code using virtualization.
- The driver prepares the VMCS, configures the APIC to generate an interrupt on performance counter overflows, and other setup work.
- The driver enters VMX non-root mode and starts the execution of target software.
- New: SMI is delivered to the processor thus forcing it to enter SMM.
- The processor core stops responding to clock interrupts and NMIs.
This means that the problem is not actually in the Simics Simulator or the vmxmon driver. Instead, it is in the SMM handler or in the hardware, both of which are really tricky to debug.
To gather more information, the smigen-based reproducer was run on some additional hardware systems. It turned out the bug did not depend on the host operating system, and it did manifest on multiple server hardware generations. Without smigen, it was mostly observed on Windows Server 2019, which indicates that it is making more SMM calls than other operating systems.
Running the Bug inside of the Simics Simulator
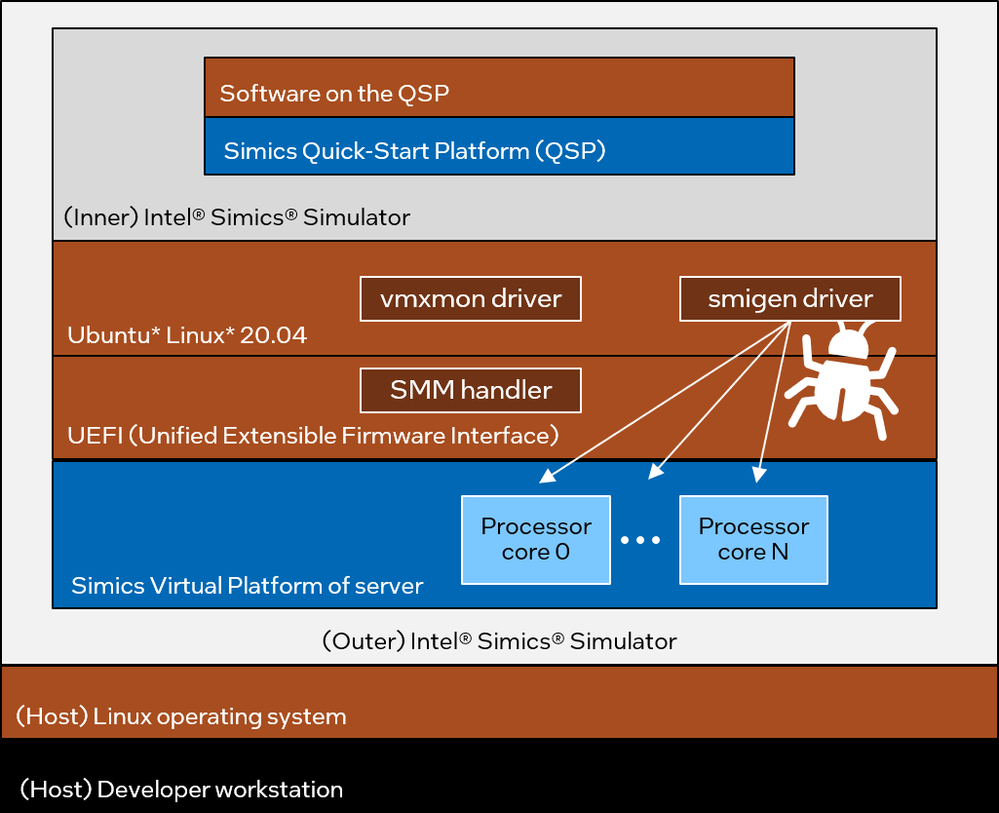
To move forward, better debug abilities were needed than what hardware provided. This is achieved by running the Simics Simulator inside the Simics Simulator itself. Initially, a setup was used that was as close as possible to the hardware setup.
This meant using a server platform model running the same UEFI as the real hardware and configured with the same number of cores as the hardware. Since the host operating system had been proven not to matter, Ubuntu* Linux 20.04 was installed on the target system instead of Windows. The Simics Quick-Start Platform (QSP) was used in the target setup, since it provides a lightweight Intel Architecture target.
The setup looks like this:
It took less than a working day to prepare the setup and trigger the reproducer of the issue.
Reproducing the setup inside of the Simics Simulator made it possible to check what was actually going on. Once the crash happened inside the simulation target system, it was easy to find the processor core that was in SMM mode, and then investigate what it was doing. The command-line session below shows how this was done:
# Find the processor that is in SMM:
running> @[c for c in SIM_get_all_processors() if c.in_smm]
[<the x86ex-nnn 'server.mb.cpu1.core[17][0]'>]
# Select it as the current processor for the debugger:
running> psel server.mb.cpu1.core[17][0]
Setting new inspection object: server.mb.cpu1.core[17][0]
running> stop
# Single-step 10 instructions
simics> si 10
[server.mb.cpu1.core[17][0]] cs: 0x0000000077acce72 p:0x000077acce72  test rax,rax
[server.mb.cpu1.core[17][0]] cs: 0x0000000077acce75 p:0x000077acce75  je 0x77acce6e
[server.mb.cpu1.core[17][0]] cs:0x0000000077acce6e p:0x000077acce6e  mov rax,qword ptr [rbp+0x30]
[server.mb.cpu1.core[17][0]] cs:0x0000000077acce72 p:0x000077acce72  test rax,rax
[server.mb.cpu1.core[17][0]] cs:0x0000000077acce75 p:0x000077acce75  je 0x77acce6e
[server.mb.cpu1.core[17][0]] cs:0x0000000077acce6e p:0x000077acce6e  mov rax,qword ptr [rbp+0x30]
[server.mb.cpu1.core[17][0]] cs:0x0000000077acce72 p:0x000077acce72  test rax,rax
[server.mb.cpu1.core[17][0]] cs:0x0000000077acce75 p:0x000077acce75  je 0x77acce6e
[server.mb.cpu1.core[17][0]] cs:0x0000000077acce6e p:0x000077acce6e  mov rax,qword ptr [rbp+0x30]
[server.mb.cpu1.core[17][0]] cs:0x0000000077acce72 p:0x000077acce72  test rax,rax
As expected, one processor got stuck in SMM while other were executing outside of SMM. The hanging core was checking a memory location in an infinite loop. The situation looked like this:
Simplifying the Setup
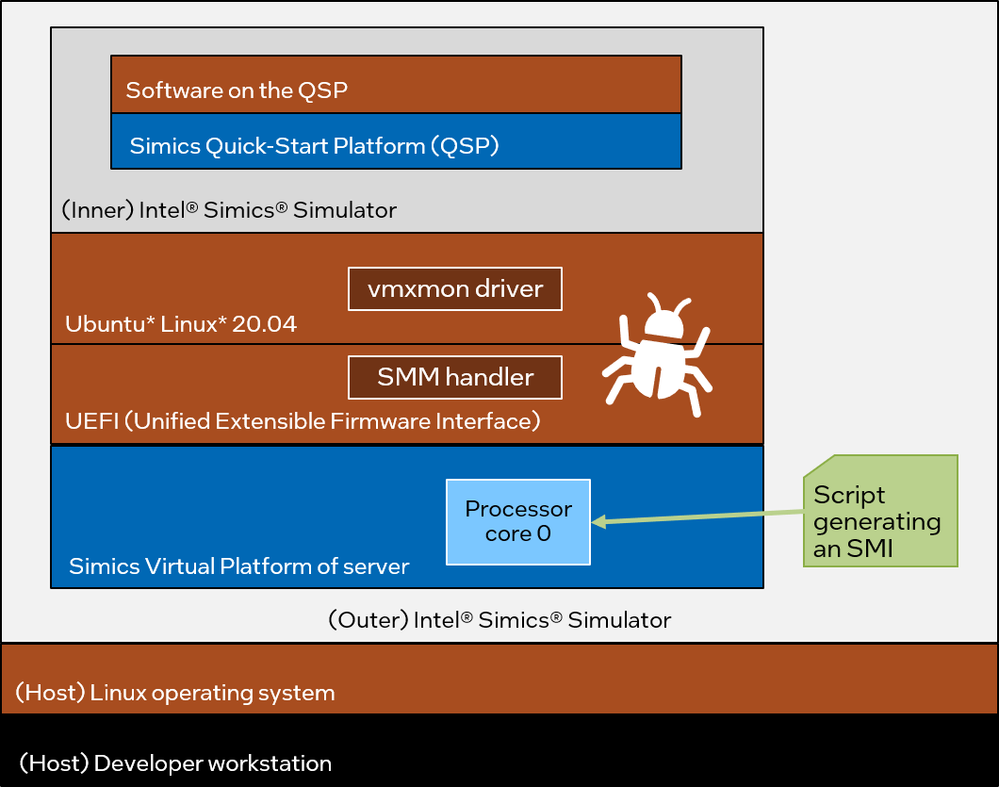
Once the bug was reproduced and proven to happen when running on the Simics Simulator, the setup could be simplified. The number of processor cores was cut down to one, and the SMI was generated using the Simics Simulator API instead of by running code on the target. The simplified setup looked like this:
Triggering the bug reliably was very easy using the Simics Simulator, using its scripting abilities. To get to the bug in the shortest possible time, a script was created that waited for a VM-entry to happen in the outer Simics Simulator, and then immediately generated an SMI.
Digging into the Real Root Cause
Once the setup was completed, simulator logging and tracing facilities were used to get more information about events happening in the system. In particular, the simulator was set up to trace all instructions the executed by the SMM handler.
The code below shows the instruction trace obtained after an SMI injection when the target system was in VMX non-root mode. After going into the SMM handler, eventually the processor triggered a debug exception (#DB) and started to run an infinite loop in the exception handler. The infinite loop is omitted as it has no interesting information.
simics> new-tracer
Trace object 'trace0' created. Enable tracing with 'trace0.start'.
simics> trace0.start
Tracing enabled. Writing text output to standard output.
simics> trace0->print_linear_address = 0
simics> trace0->print_virtual_address = 0
simics> trace0->print_memory_type =  0
simics> trace0->print_access_type = 0
simics> trace-exception -all
simics> server.mb.cpu0.core[0][0].log-level 4
[server.mb.cpu0.core[0][0]] Changing log level: 1 -> 4
simics> @c = conf.server.mb.cpu0.core[0][0]
simics> @c.ports.SMI.signal.signal_raise()
[server.mb.cpu0.core[0][0] info] SMI raised
simics> c
inst: [       78] CPU  0 <p:0x0000779bb190> 48 8b 15 31 7e 00 00 mov rdx,qword ptr [rip+0x7e31]
data: [       69] CPU  0 <p:0x0000779c2fc8> Read   8 bytes  0x2400
inst: [       79] CPU  0 <p:0x0000779bb197> eb 0e             jmp 0x779bb1a7
inst: [       80] CPU  0 <p:0x0000779bb1a7> 0f 23 f1          mov dr6,rcx
inst: [       81] CPU  0 <p:0x0000779bb1aa> 0f 23 fa          mov dr7,rdx
...
<part of the output omitted>
...
inst: [ 35347272] CPU  0 <p:0x0000779bb1f4> 0f 21 fa          mov rdx,dr7
[server.mb.cpu0.core[0][0] info] DR7 read when DR7.GD set. #DB raised.
[server.mb.cpu0.core[0][0] trace-exception] Exception 1: Debug_Exception
exce: [        3] CPU  0 exception   1 (Debug_Exception)
...
<the rest of the output omitted>
The complete observed flow is shown below. Starting in VMX root mode, the execution moves into VMX non-root mode (VM-entry), followed by an SMI getting into SMM, and finally a #DB exception leading to the infinite loop. The remaining question was why the SMM handler caused the #DB exception.
The simulator log message indicates that the exception was generated because the code attempted to read the register DR7 (instruction number 35347272) when DR7.GD (bit 13, general detect enable) was set. This bit enables debug-register protection, making the processor raise a debug exception when MOV instructions access a debug register. Looking back through the trace, the SMM handler reads the value of the DR7 register from the SMM save area (instruction number 78). The value is 0x2400 and GD bit is set. The value is then written (without modification) to the DR7 register (instruction number 81), enabling debug register protection.
Later, the SMM handler tries to read the DR7 register, without checking whether this is indeed allowed in the current processor state. This read causes the debug exception and jump to the infinite loop. The SMM handler code simply assumed that the DR7.GD bit was not set.
The DR7 value used in VMX non-root mode is determined by the VMCS structure, which is in turn managed by the vmxmon driver. The purpose of setting the DR7.GD bit was to intercept all accesses to debug registers, as that is necessary to provide correct results for the target code running on top the simulator. However, the same result can be achieved via the “MOV-DR exiting” VM-execution control setting.
Thus, updating the vmxmon driver not to set the DR7.GD bit and use the alternative mechanism avoids the buggy scenario. This increases the reliability of the Simics Simulator regardless of the software and hardware that it is running on. If the SMM handler in one UEFI exhibits this behavior, it is possible that others do too.
The actual patch to the Simics vmxmon driver consisted of just a single line of code:
                 /* debug registers */
                 u64 dr7 = (x->dr7 & 0xffff23ff) | 0x0400;
+
+                /* Certain BIOSes can't handle DR7.GD bit correctly.
+                 * As a workaround vmxmon never sets this bit.
+                 *
+                 * It is safe to disable debug-register protection in DR7
+                 * because all MOV_DR instructions are intercepted:
+                 * PROC_MOV_DR_EXITING is always set. */
+                dr7 &= ~BIT(13);
+
                 __vmwrite(VMCS_GUEST_DR7, dr7);
Recap
That was the end of the story. To recap, the bug here was unusually complex, as it involved the vmxmon driver, the operating system, and the SMM part of the UEFI. It only happened when the operating system triggered an SMI while vmxmon was running code in VMX non-root mode. This combination of events was extraordinarily rare. It only became noticeable with Windows Server 2019, which is triggering SMIs much more frequently than other operating systems (but still not very often as evidenced by the time needed to run to reproduce the issue).
The productive steps of the process were the following:
- System crashes happened on production machines.
- The Windows minidump pointed out that the system was stuck waiting for clock interrupts, and that the vmxmon driver was loaded.
- Configure system to get a full crash dump.
- Crash dump stack trace points at the VM-exit code in vmxmon.
- Conclude that vmxmon is likely involved in the crash.
- Reproduce the crashes in the Simics simulator lab, using hardware and software matching the production machines.
- Crash dumps indicate that the processor is not responding to clock interrupts.
- Note that NMI might be the cause, turn off NMI usage in vmxmon. Did not help.
- Update vmxmon to save additional information on VM-exit, VM-enter, and NMI handling.
- Note that the crash happens after VM-enter.
- Realize that the processor is not responding to NMIs either.
- Realize that SMI might be the problem.
- Apply smigen tool to cause more frequent SMIs, confirming the SMI hypothesis.
- Replicate the crashing setup inside of the Simics simulator using the same software as on the hardware: smigen + real UEFI + hardware model + the Simics simulator.
- Simplify the Simics simulation setup to use a single processor core + scripted SMI injection instead of smigen.
- Trace the execution from a scripted SMI, note the #DB exception caused by DR7 settings and accesses.
- At that point, the root cause was finally clear.
While being long for a blog post, this is still the short version of the story. It doesn’t contain all the false hypotheses and wrong paths tried before arriving at the right answer.
For example, it might seem easy to realize that the processor core was not responding to NMIs. That would have been relatively simple to understand with a live debugger attached to the hardware system, but for various reasons live debugging was not available. In fact, the longest time was spent getting from “the processor core is not responding to clock interrupts” to “the processor core is unresponsive and not responding to any interrupt.” Once this was clear, the rest of the debug was comparatively straightforward.
Conclusions
Low-level debugging is hard, but nothing is impossible when using the Simics Simulator. The simulator provides unique capabilities for digging through low-level hardware mechanisms. On hardware, a mistake tends to result in an irrevocably broken system, but in the simulator, the state is available for inspection even if the target software stack is crashed. Additionally, the control over inputs such as interrupts and the ability to set breakpoints on hardware events provide rare debug power.
Running the Simics Simulator as a workload under the Simics Simulator is a natural consequence of the fact that the simulator can run real software loads–including those that involve the use of hardware virtualization.
 Jakob Engblom works at Intel in Stockholm, Sweden, as director of simulation technology ecosystem. He has been working with virtual platforms and full-system simulation in support for software and system acceleration, development, debug, and test since 2002. At Intel, he helps users and customers succeed with the Intel Simics Simulator and related simulation technologies - with everything from packaged training to hands-on coding and solution architecture. He participates in the ecosystem for virtual platforms including in Accellera workgroups and the DVCon Europe conference.
You must be a registered user to add a comment. If you've already registered, sign in. Otherwise, register and sign in.


