- Mark as New
- Bookmark
- Subscribe
- Mute
- Subscribe to RSS Feed
- Permalink
- Report Inappropriate Content
I am trying to look at raw Gigabit Ethernet waveforms on my oscilloscope, but I have no idea how to set it up:
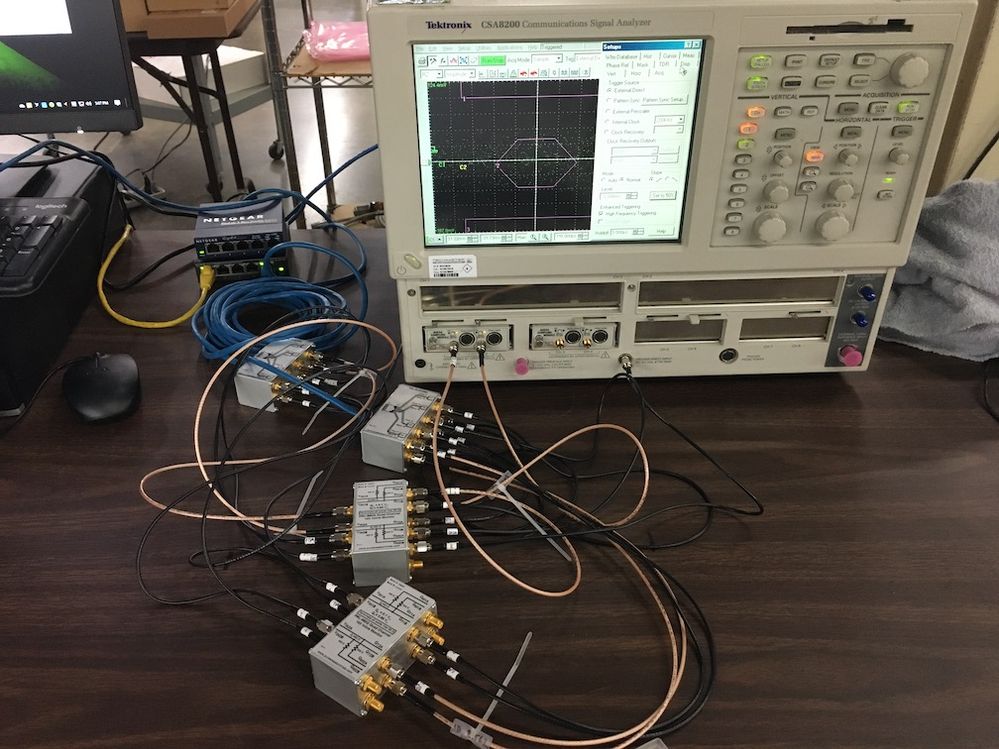
I have a pair of RJ45-to-SMA adapter boxes that allow me to carry a set of Ethernet signals over eight 50 Ohm coax cables, and then I’ve interrupted those 50 Ohm coax cables with a set of differential pickoff boxes that allow me to probe any pair with 10x attenuation on the scope:
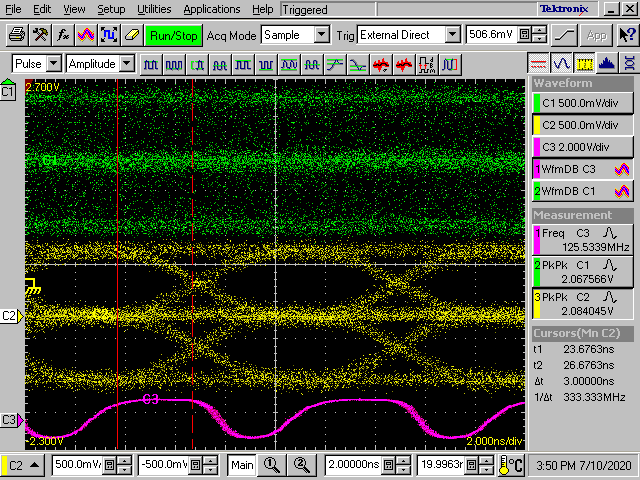
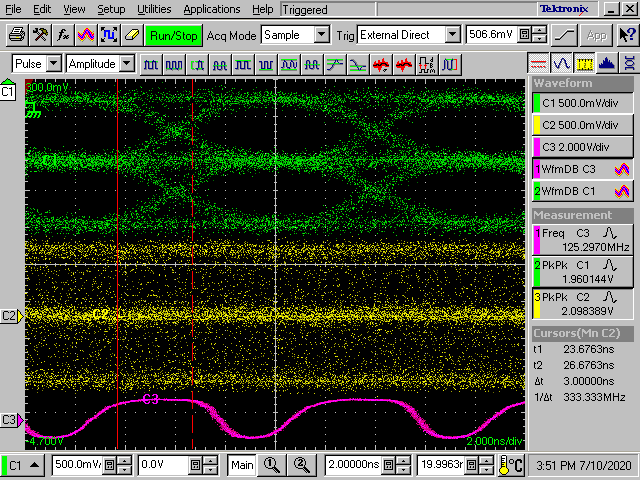
I've got an active Ethernet link from a transceiver eval board to a PC, and if I force the mode to 100Base-TX from the PC side and pick the 125 MHz clock off of the eval board for my trigger I can see the MLT-3 eye:
Green is Pin 1 and yellow is Pin 3, so the one that syncs up is the Tx side that's clocked from the 125 MHz that I'm extracting from the eval board, while the one that doesn't sync up is being clocked from the other side of the link, and it's a coin flip each time I reset the link, because of the AutoMDI-X. Or at least I think that's the way it works. Someone please correct me if I'm wrong!
But I haven't found a way to see the raw PAM-5 signal when I change the mode to 1000Base-T. Is this because it's always full-duplex all the time, so I have two asynchronous signals laid atop one another? Even then I'd think I'd get a PAM-5 eye with some asynchronous junk laid on top of that, but I don't get anything recognizable at all.
Link Copied
- Subscribe to RSS Feed
- Mark Topic as New
- Mark Topic as Read
- Float this Topic for Current User
- Bookmark
- Subscribe
- Printer Friendly Page


