- Mark as New
- Bookmark
- Subscribe
- Mute
- Subscribe to RSS Feed
- Permalink
- Report Inappropriate Content
Hi all
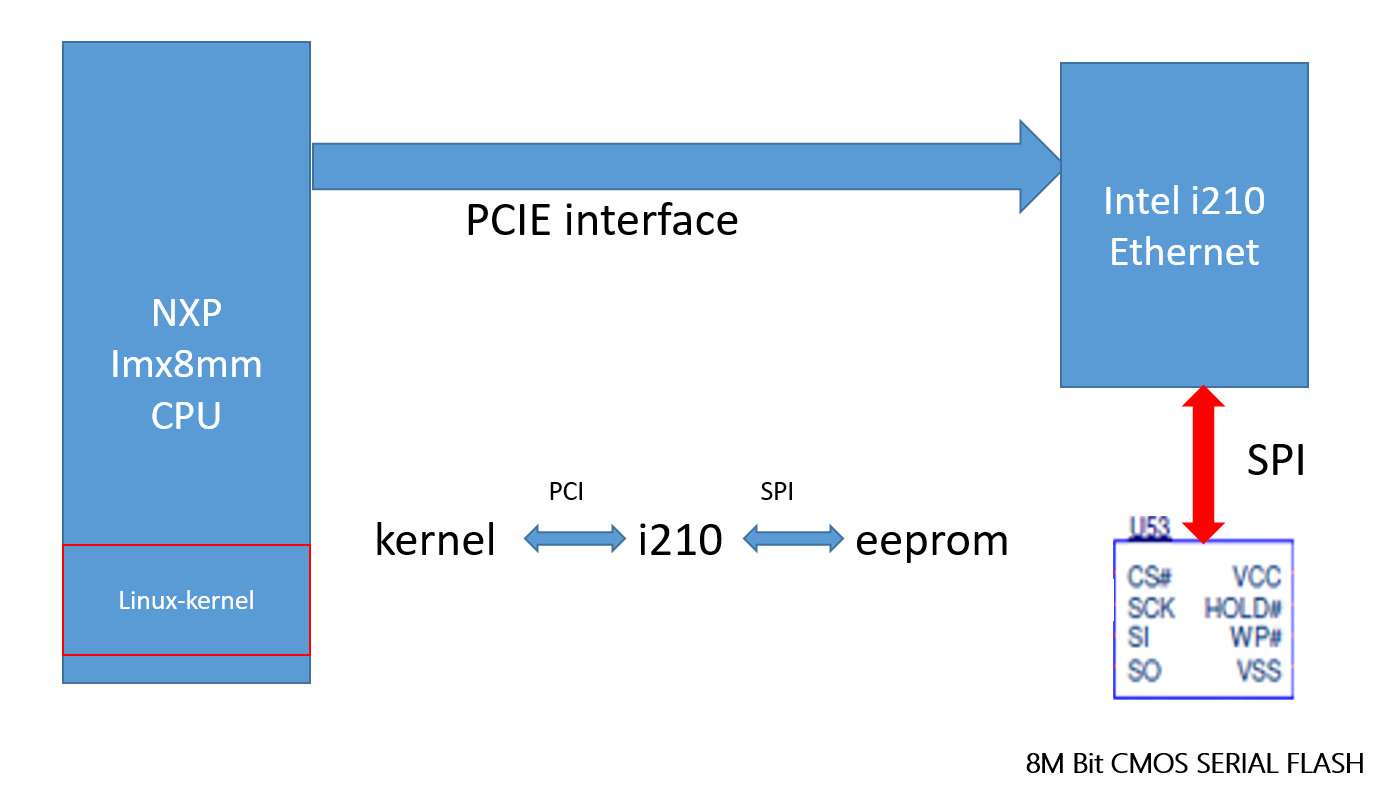
I have a question about the I210 issue. Here is my information.
OS :Yocto and Linux version is 5.10.
Platform : NXP imx8mm.
Question :
(1) Issue linked
https://www.youtube.com/watch?v=wOhM4aDP9ws
(2) kernel messages
[ 2.580191] pci 0000:01:00.0: [8086:1533] type 00 class 0x020000
(3)
I try get network connection established. In dmesg I get repeatively messages regarding a TX hang and adapter reset:
[ 202.700164] igb 0000:01:00.0 enp1s0: igb: enp1s0 NIC Link is Up 1000 Mbps
(4)
Here is my log :
[ 15.076159] NETDEV WATCHDOG: eth1 (igb): transmit queue 0 timed out
[ 15.082512] WARNING: CPU: 0 PID: 0 at net/sched/sch_generic.c:485 dev_watchdog+0x300/0x310
[ 15.090781] Modules linked in: overlay fsl_jr_uio caam_jr caamkeyblob_desc caamhash_desc caamalg_desc crypto_engine rng_core authenc libdes crct10dif_ce caam secvio error gpio_ir_recv rc_core fuse
[ 15.108299] CPU: 0 PID: 0 Comm: swapper/0 Not tainted 5.10.72-lts-5.10.y+g22ec7e8cbace #1
[ 15.116475] Hardware name: FSL i.MX8MM EVK board (DT)
[ 15.121529] pstate: 20000005 (nzCv daif -PAN -UAO -TCO BTYPE=--)
[ 15.127541] pc : dev_watchdog+0x300/0x310
[ 15.131552] lr : dev_watchdog+0x300/0x310
[ 15.135562] sp : ffff800011d4bd90
[ 15.138876] x29: ffff800011d4bd90 x28: ffff0000c1781940
[ 15.144193] x27: 0000000000000004 x26: ffff0000c177c480
[ 15.149511] x25: 0000000000000140 x24: 00000000ffffffff
[ 15.154829] x23: ffff0000c177c3dc x22: 0000000000000000
[ 15.160144] x21: ffff800011b36000 x20: ffff0000c177c000
[ 15.165460] x19: 0000000000000000 x18: 0000000000000030
[ 15.170775] x17: 0000000000000000 x16: 0000000000000000
[ 15.176091] x15: ffff800011b427f8 x14: ffffffffffffffff
[ 15.181406] x13: ffff800011b517b0 x12: 00000000000005dc
[ 15.186723] x11: 00000000000001f4 x10: ffff800011ba97b0
[ 15.192041] x9 : 00000000fffff000 x8 : ffff800011b517b0
[ 15.197359] x7 : ffff800011ba97b0 x6 : 0000000000000003
[ 15.202674] x5 : 0000000000000000 x4 : 0000000000000000
[ 15.207989] x3 : 0000000000000000 x2 : 0000000000000100
[ 15.213305] x1 : e2325e19108dc600 x0 : 0000000000000000
[ 15.218621] Call trace:
[ 15.221073] dev_watchdog+0x300/0x310
[ 15.224741] call_timer_fn.constprop.0+0x24/0x80
[ 15.229362] __run_timers.part.0+0x1f4/0x22c
[ 15.233633] run_timer_softirq+0x3c/0x7c
[ 15.237558] efi_header_end+0x124/0x290
[ 15.241396] irq_exit+0xdc/0xfc
[ 15.244541] __handle_domain_irq+0x80/0xe0
[ 15.248639] gic_handle_irq+0xc0/0x140
[ 15.252388] el1_irq+0xcc/0x180
[ 15.255534] cpuidle_enter_state+0x130/0x2f0
[ 15.259806] cpuidle_enter+0x38/0x50
[ 15.263385] do_idle+0x218/0x2a0
[ 15.266615] cpu_startup_entry+0x28/0x70
[ 15.270541] rest_init+0xd8/0xe8
[ 15.273774] arch_call_rest_init+0x10/0x1c
[ 15.277871] start_kernel+0x4ac/0x4e4
[ 15.281534] ---[ end trace d8df749d650a7ef8 ]---
a100 login:
a100 login: [ 15.286387] igb 0000:01:00.0 eth1: Reset adapter
root
root@a100:~# [ 18.268094] igb 0000:01:00.0 eth1: igb: eth1 NIC Link is Up 100 Mbps Full Duplex, Flow Control: RX/TX
[ 20.960737] igb 0000:01:00.0: Detected Tx Unit Hang
[ 20.960737] Tx Queue <0>
[ 20.960737] TDH <0>
[ 20.960737] TDT <1>
[ 20.960737] next_to_use <1>
[ 20.960737] next_to_clean <0>
[ 20.960737] buffer_info[next_to_clean]
[ 20.960737] time_stamp <fffeece7>
[ 20.960737] next_to_watch <00000000c7cd17aa>
[ 20.960737] jiffies <fffeef80>
[ 20.960737] desc.status <4f4000>
[ 21.005949] igb 0000:01:00.0: Detected Tx Unit Hang
[ 21.005949] Tx Queue <1>
[ 21.005949] TDH <0>
[ 21.005949] TDT <1>
[ 21.005949] next_to_use <1>
[ 21.005949] next_to_clean <0>
[ 21.005949] buffer_info[next_to_clean]
[ 21.005949] time_stamp <fffeece4>
[ 21.005949] next_to_watch <00000000058d6273>
[ 21.005949] jiffies <fffeef80>
[ 21.005949] desc.status <1b8000>
[ 21.051174] igb 0000:01:00.0: Detected Tx Unit Hang
[ 21.051174] Tx Queue <2>
[ 21.051174] TDH <0>
[ 21.051174] TDT <1>
[ 21.051174] next_to_use <1>
[ 21.051174] next_to_clean <0>
[ 21.051174] buffer_info[next_to_clean]
[ 21.051174] time_stamp <fffeedf1>
[ 21.051174] next_to_watch <00000000f8982935>
[ 21.051174] jiffies <fffeef97>
[ 21.051174] desc.status <118000>
[ 22.784344] igb 0000:01:00.0: Detected Tx Unit Hang
[ 22.784344] Tx Queue <0>
[ 22.784344] TDH <0>
[ 22.784344] TDT <1>
[ 22.784344] next_to_use <1>
[ 22.784344] next_to_clean <0>
[ 22.784344] buffer_info[next_to_clean]
[ 22.784344] time_stamp <fffeece7>
[ 22.784344] next_to_watch <00000000c7cd17aa>
[ 22.784344] jiffies <fffef148>
[ 22.784344] desc.status <4f4000>
[ 22.829554] igb 0000:01:00.0: Detected Tx Unit Hang
[ 22.829554] Tx Queue <1>
[ 22.829554] TDH <0>
[ 22.829554] TDT <1>
[ 22.829554] next_to_use <1>
[ 22.829554] next_to_clean <0>
[ 22.829554] buffer_info[next_to_clean]
[ 22.829554] time_stamp <fffeece4>
[ 22.829554] next_to_watch <00000000058d6273>
[ 22.829554] jiffies <fffef148>
[ 22.829554] desc.status <1b8000>
[ 22.874828] igb 0000:01:00.0: Detected Tx Unit Hang
[ 22.874828] Tx Queue <2>
[ 22.874828] TDH <0>
[ 22.874828] TDT <1>
[ 22.874828] next_to_use <1>
[ 22.874828] next_to_clean <0>
[ 22.874828] buffer_info[next_to_clean]
[ 22.874828] time_stamp <fffeedf1>
[ 22.874828] next_to_watch <00000000f8982935>
[ 22.874828] jiffies <fffef15e>
[ 22.874828] desc.status <118000>
[ 24.031849] igb 0000:01:00.0 eth1: Reset adapter
[ 27.032082] igb 0000:01:00.0 eth1: igb: eth1 NIC Link is Up 100 Mbps Full Duplex, Flow Control: RX/TX
[ 28.832147] igb 0000:01:00.0: Detected Tx Unit Hang
[ 28.832147] Tx Queue <0>
[ 28.832147] TDH <0>
[ 28.832147] TDT <1>
[ 28.832147] next_to_use <1>
[ 28.832147] next_to_clean <0>
[ 28.832147] buffer_info[next_to_clean]
[ 28.832147] time_stamp <fffef578>
[ 28.832147] next_to_watch <00000000c7cd17aa>
[ 28.832147] jiffies <fffef730>
[ 28.832147] desc.status <4f4000>
[ 28.877358] igb 0000:01:00.0: Detected Tx Unit Hang
[ 28.877358] Tx Queue <1>
[ 28.877358] TDH <0>
[ 28.877358] TDT <1>
[ 28.877358] next_to_use <1>
[ 28.877358] next_to_clean <0>
[ 28.877358] buffer_info[next_to_clean]
[ 28.877358] time_stamp <fffef573>
[ 28.877358] next_to_watch <00000000058d6273>
[ 28.877358] jiffies <fffef73b>
[ 28.877358] desc.status <1b8000>
[ 30.847744] igb 0000:01:00.0: Detected Tx Unit Hang
[ 30.847744] Tx Queue <0>
[ 30.847744] TDH <0>
[ 30.847744] TDT <1>
[ 30.847744] next_to_use <1>
[ 30.847744] next_to_clean <0>
[ 30.847744] buffer_info[next_to_clean]
[ 30.847744] time_stamp <fffef578>
[ 30.847744] next_to_watch <00000000c7cd17aa>
[ 30.847744] jiffies <fffef928>
[ 30.847744] desc.status <4f4000>
[ 30.893028] igb 0000:01:00.0: Detected Tx Unit Hang
[ 30.893028] Tx Queue <1>
[ 30.893028] TDH <0>
[ 30.893028] TDT <1>
[ 30.893028] next_to_use <1>
[ 30.893028] next_to_clean <0>
[ 30.893028] buffer_info[next_to_clean]
[ 30.893028] time_stamp <fffef573>
[ 30.893028] next_to_watch <00000000058d6273>
[ 30.893028] jiffies <fffef933>
[ 30.893028] desc.status <1b8000>
[ 30.938249] igb 0000:01:00.0: Detected Tx Unit Hang
[ 30.938249] Tx Queue <2>
[ 30.938249] TDH <0>
[ 30.938249] TDT <1>
[ 30.938249] next_to_use <1>
[ 30.938249] next_to_clean <0>
[ 30.938249] buffer_info[next_to_clean]
[ 30.938249] time_stamp <fffef6bb>
[ 30.938249] next_to_watch <00000000f8982935>
[ 30.938249] jiffies <fffef93e>
[ 30.938249] desc.status <118000>
[ 32.831747] igb 0000:01:00.0: Detected Tx Unit Hang
[ 32.831747] Tx Queue <0>
[ 32.831747] TDH <0>
[ 32.831747] TDT <1>
[ 32.831747] next_to_use <1>
[ 32.831747] next_to_clean <0>
[ 32.831747] buffer_info[next_to_clean]
[ 32.831747] time_stamp <fffef578>
[ 32.831747] next_to_watch <00000000c7cd17aa>
[ 32.831747] jiffies <fffefb18>
[ 32.831747] desc.status <4f4000>
[ 32.876970] igb 0000:01:00.0: Detected Tx Unit Hang
[ 32.876970] Tx Queue <1>
[ 32.876970] TDH <0>
[ 32.876970] TDT <1>
[ 32.876970] next_to_use <1>
[ 32.876970] next_to_clean <0>
[ 32.876970] buffer_info[next_to_clean]
[ 32.876970] time_stamp <fffef573>
[ 32.876970] next_to_watch <00000000058d6273>
[ 32.876970] jiffies <fffefb23>
[ 32.876970] desc.status <1b8000>
[ 32.922194] igb 0000:01:00.0: Detected Tx Unit Hang
[ 32.922194] Tx Queue <2>
[ 32.922194] TDH <0>
[ 32.922194] TDT <1>
[ 32.922194] next_to_use <1>
[ 32.922194] next_to_clean <0>
[ 32.922194] buffer_info[next_to_clean]
[ 32.922194] time_stamp <fffef6bb>
[ 32.922194] next_to_watch <00000000f8982935>
[ 32.922194] jiffies <fffefb2e>
[ 32.922194] desc.status <118000>
[ 33.759541] VSD_3V3: disabling
[ 34.847735] igb 0000:01:00.0: Detected Tx Unit Hang
[ 34.847735] Tx Queue <0>
[ 34.847735] TDH <0>
[ 34.847735] TDT <1>
[ 34.847735] next_to_use <1>
[ 34.847735] next_to_clean <0>
[ 34.847735] buffer_info[next_to_clean]
[ 34.847735] time_stamp <fffef578>
[ 34.847735] next_to_watch <00000000c7cd17aa>
[ 34.847735] jiffies <fffefd10>
[ 34.847735] desc.status <4f4000>
[ 34.893044] igb 0000:01:00.0: Detected Tx Unit Hang
[ 34.893044] Tx Queue <1>
[ 34.893044] TDH <0>
[ 34.893044] TDT <1>
[ 34.893044] next_to_use <1>
[ 34.893044] next_to_clean <0>
[ 34.893044] buffer_info[next_to_clean]
[ 34.893044] time_stamp <fffef573>
[ 34.893044] next_to_watch <00000000058d6273>
[ 34.893044] jiffies <fffefd1b>
[ 34.893044] desc.status <1b8000>
[ 34.938272] igb 0000:01:00.0: Detected Tx Unit Hang
[ 34.938272] Tx Queue <2>
[ 34.938272] TDH <0>
[ 34.938272] TDT <1>
[ 34.938272] next_to_use <1>
[ 34.938272] next_to_clean <0>
[ 34.938272] buffer_info[next_to_clean]
[ 34.938272] time_stamp <fffef6bb>
[ 34.938272] next_to_watch <00000000f8982935>
[ 34.938272] jiffies <fffefd26>
[ 34.938272] desc.status <118000>
[ 36.831565] igb 0000:01:00.0 eth1: Reset adapter
[ 36.836243] igb 0000:01:00.0 eth1: igb: eth1 NIC Link is Up 100 Mbps Full Duplex, Flow Control: RX/TX
[ 36.973032] igb 0000:01:00.0 eth1: igb: eth1 NIC Link is Down
[ 37.823691] igb 0000:01:00.0 eth1: Reset adapter
[ 39.839717] igb 0000:01:00.0 eth1: Reset adapter
[ 42.784090] igb 0000:01:00.0 eth1: igb: eth1 NIC Link is Up 100 Mbps Full Duplex, Flow Control: RX/TX
[ 45.024153] igb 0000:01:00.0: Detected Tx Unit Hang
[ 45.024153] Tx Queue <0>
[ 45.024153] TDH <0>
[ 45.024153] TDT <1>
[ 45.024153] next_to_use <1>
[ 45.024153] next_to_clean <0>
[ 45.024153] buffer_info[next_to_clean]
[ 45.024153] time_stamp <ffff04d8>
[ 45.024153] next_to_watch <00000000c7cd17aa>
[ 45.024153] jiffies <ffff0700>
[ 45.024153] desc.status <4f4000>
[ 45.069369] igb 0000:01:00.0: Detected Tx Unit Hang
[ 45.069369] Tx Queue <1>
[ 45.069369] TDH <0>
[ 45.069369] TDT <1>
[ 45.069369] next_to_use <1>
[ 45.069369] next_to_clean <0>
[ 45.069369] buffer_info[next_to_clean]
[ 45.069369] time_stamp <ffff04d5>
[ 45.069369] next_to_watch <00000000058d6273>
[ 45.069369] jiffies <ffff070b>
[ 45.069369] desc.status <1b8000>
[ 45.114595] igb 0000:01:00.0: Detected Tx Unit Hang
[ 45.114595] Tx Queue <2>
[ 45.114595] TDH <0>
[ 45.114595] TDT <1>
[ 45.114595] next_to_use <1>
[ 45.114595] next_to_clean <0>
[ 45.114595] buffer_info[next_to_clean]
[ 45.114595] time_stamp <ffff0561>
[ 45.114595] next_to_watch <00000000f8982935>
[ 45.114595] jiffies <ffff0716>
[ 45.114595] desc.status <118000>
[ 47.839743] igb 0000:01:00.0 eth1: Reset adapter
[ 50.780084] igb 0000:01:00.0 eth1: igb: eth1 NIC Link is Up 100 Mbps Full Duplex, Flow Control: RX/TX
[ 52.960435] igb 0000:01:00.0: Detected Tx Unit Hang
[ 52.960435] Tx Queue <0>
[ 52.960435] TDH <0>
[ 52.960435] TDT <1>
[ 52.960435] next_to_use <1>
[ 52.960435] next_to_clean <0>
[ 52.960435] buffer_info[next_to_clean]
[ 52.960435] time_stamp <ffff0ca7>
[ 52.960435] next_to_watch <00000000c7cd17aa>
[ 52.960435] jiffies <ffff0ec0>
[ 52.960435] desc.status <4f4000>
[ 53.005654] igb 0000:01:00.0: Detected Tx Unit Hang
[ 53.005654] Tx Queue <1>
[ 53.005654] TDH <0>
[ 53.005654] TDT <1>
[ 53.005654] next_to_use <1>
[ 53.005654] next_to_clean <0>
[ 53.005654] buffer_info[next_to_clean]
[ 53.005654] time_stamp <ffff0ca4>
[ 53.005654] next_to_watch <00000000058d6273>
[ 53.005654] jiffies <ffff0ecb>
[ 53.005654] desc.status <1b8000>
[ 53.050903] igb 0000:01:00.0: Detected Tx Unit Hang
[ 53.050903] Tx Queue <2>
[ 53.050903] TDH <0>
[ 53.050903] TDT <1>
[ 53.050903] next_to_use <1>
[ 53.050903] next_to_clean <0>
[ 53.050903] buffer_info[next_to_clean]
[ 53.050903] time_stamp <ffff0d31>
[ 53.050903] next_to_watch <00000000f8982935>
[ 53.050903] jiffies <ffff0ed6>
[ 53.050903] desc.status <118000>
[ 54.847755] igb 0000:01:00.0: Detected Tx Unit Hang
[ 54.847755] Tx Queue <0>
[ 54.847755] TDH <0>
[ 54.847755] TDT <1>
[ 54.847755] next_to_use <1>
[ 54.847755] next_to_clean <0>
[ 54.847755] buffer_info[next_to_clean]
[ 54.847755] time_stamp <ffff0ca7>
[ 54.847755] next_to_watch <00000000c7cd17aa>
[ 54.847755] jiffies <ffff1098>
[ 54.847755] desc.status <4f4000>
[ 54.892978] igb 0000:01:00.0: Detected Tx Unit Hang
[ 54.892978] Tx Queue <1>
[ 54.892978] TDH <0>
[ 54.892978] TDT <1>
[ 54.892978] next_to_use <1>
[ 54.892978] next_to_clean <0>
[ 54.892978] buffer_info[next_to_clean]
[ 54.892978] time_stamp <ffff0ca4>
[ 54.892978] next_to_watch <00000000058d6273>
[ 54.892978] jiffies <ffff10a3>
[ 54.892978] desc.status <1b8000>
[ 54.938192] igb 0000:01:00.0: Detected Tx Unit Hang
[ 54.938192] Tx Queue <2>
[ 54.938192] TDH <0>
[ 54.938192] TDT <1>
[ 54.938192] next_to_use <1>
[ 54.938192] next_to_clean <0>
[ 54.938192] buffer_info[next_to_clean]
[ 54.938192] time_stamp <ffff0d31>
[ 54.938192] next_to_watch <00000000f8982935>
[ 54.938192] jiffies <ffff10ae>
[ 54.938192] desc.status <118000>
Please kindly help me .
thank you
tzeng015
Link Copied
- Subscribe to RSS Feed
- Mark Topic as New
- Mark Topic as Read
- Float this Topic for Current User
- Bookmark
- Subscribe
- Printer Friendly Page