- Mark as New
- Bookmark
- Subscribe
- Mute
- Subscribe to RSS Feed
- Permalink
- Report Inappropriate Content
I'm working for a smaller company designing computers using COM Express modules. We're recently updated an older platform with the Intel i7-4650UE (4th gen) to the i7-1185GRE (11th gen). Everything works much better when measuring the performance, but there are two numbers that is a real problem, the 2D performance. That might not be a big deal for most of us, but we're bound to some requirements that we need to fulfill.
Testing with the Passmark PerformanceTest on Windows 10 x64 (LTSC), we get lower scores for the 2D in the new platform than for the Intel HD5000 used in the older platform. Going deeper into the numbers show that it is the Image Filters and Image Rendering scores that are much lower, every other measurements is really good.
I've moved away from our platform and done lots of testing on a commercial platform, a Dell Latitude 5520 with the similar CPU i7-1185G7 3.0GHz. It has the similar bad score on these numbers, so that looks a bit troublesome. But when I do the measurement in different resolutions I will get some strange numbers on two resolutions, 1680x1050 and 1400x1050. Here the numbers are indeed very good. This led me to doing test with other CPU/graphic cards to see if the problem has something to do with the Passmark testing program or if different graphic cards does not have a problem with these resolutions.
The i7-1185GRE and i7-1185G7E are using the Intel Xe Iris graphics, I've installed the 31.0.101.3729 driver and even used the Dell supplied version 31.0.101.3251. I've check an older platform that uses the P630 graphics, but another driver: 31.0.101.2111. Both graphic cards has this issue. I noticed that a newer version has been release, the 31.0.101.3790, but it shows similar results.
To compare with something else than Intel I grabbed an older AMD graphics card, an OEM HD8670. That card and driver has a linear performance score when comparing different resolutions, I guess that is the performance penalty that Passmark adds for using lower resolutions.
This testing is not just a number; when performing the 2D DirectX 11 Image Filter test, one can see that the rotating image is slow when the number is low. So it might have something to do with what the user really has for look and feel in the system. Anyway, for me as a test engineer I just need a number.
Right now I think there is something with the drivers that makes the performance score be so different between resolutions. Does the driver optimize memory usage depending on used resolution? What can make the speed of image rendering double? Or what can make the speed of image rendering cut into half? I think that this is the right question to here; the performance of the other resolutions should be doubled into the same numbers as for the 1680/1400x1050 tests.
After working a lot of hours with this problem, I checked the GPU usage with TechPowerUp's GPU-Z tool. It shows that the score follows the percentage of used GPU in the DX11 test - the 1680/1400x1050 resolutions manage to use like 93-94% of the GPU, other resolutions only use some 30-54%, giving the lower score.
So, the problem is easy to replicate:
* Select resolution in Windows
* Run the PerformanceTest 2D tab and only the Image Rendering test. It takes about 5s.
* Verify the score for different resolutions - some has a performance tap because the GPU is not fully used.
What I would like is that the driver uses most of the GPU during the test, not 50%. I'm aware that there are advanced turbo, temperature and power limit algorithms involved in this too, but as the tests can be replicated during random testing, I guess there are something else involved here.
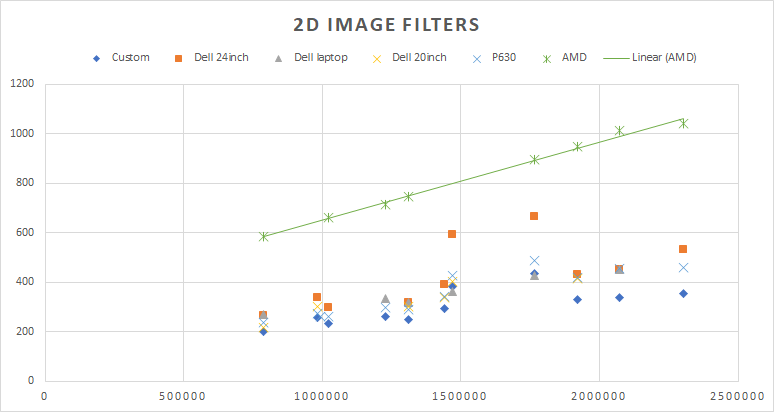
I'll add two graphs of the 2D Image Rendering score and the 2D Image Filtering score showing the 'abnormal' good numbers for two resolutions.
Link Copied
- Subscribe to RSS Feed
- Mark Topic as New
- Mark Topic as Read
- Float this Topic for Current User
- Bookmark
- Subscribe
- Printer Friendly Page