- Mark as New
- Bookmark
- Subscribe
- Mute
- Subscribe to RSS Feed
- Permalink
- Report Inappropriate Content
The results of visualization indicates 0-255 classes however this custom NN segmentater is trained on binary class !
The "common semantic" dataset looks right because it is uploading correctly by the workbench (import/upload dataset) including this json file:
{
"label_map": {"0" : "no-cloud", "1" : "cloud"},
"background_label":"0",
"segmentation_colors":[[0, 0, 0], [255, 255, 255]]
}
Once the project is created with the relevant custom NN and "vizualise output" is applied on several images then more than 2 classes (from class#0 until class#255) are listed in "model predictions" !
Could you please explain this problem ?
- Mark as New
- Bookmark
- Subscribe
- Mute
- Subscribe to RSS Feed
- Permalink
- Report Inappropriate Content
Hi fredf,
This thread will no longer be monitored since we have provided solution and answer. If you need any additional information from Intel, please submit a new question.
Regards,
Peh
Link Copied
- Mark as New
- Bookmark
- Subscribe
- Mute
- Subscribe to RSS Feed
- Permalink
- Report Inappropriate Content
Hi fredf,
Thanks for reaching out to us.
Could you please share your model and test images so we can investigate the issue?
Regards,
Alexander
- Mark as New
- Bookmark
- Subscribe
- Mute
- Subscribe to RSS Feed
- Permalink
- Report Inappropriate Content
Hello Alexander,
Please find in attachment the IR model of this tiny segmenter and the dataset used to create the project including images that can be used for vizualisation.
Thank you for your help!
fred
NB: we have additionnal question about the OV performance metrics (throughput versus batch size) do you please recommanded to open another discussion or to complette this one?
- Mark as New
- Bookmark
- Subscribe
- Mute
- Subscribe to RSS Feed
- Permalink
- Report Inappropriate Content
Could please also attach model .bin file?
Regarding your additional question - please proceed as it more convenient for you
- Mark as New
- Bookmark
- Subscribe
- Mute
- Subscribe to RSS Feed
- Permalink
- Report Inappropriate Content
Please find in attachment the .bin zipped cause the format is not compliant with the sharing box... bye
- Mark as New
- Bookmark
- Subscribe
- Mute
- Subscribe to RSS Feed
- Permalink
- Report Inappropriate Content
Dear Alexander I take benefit to be in contact with one OpenVino expert to explain our resulting performances provided in the attachment please:
- as expected asynchronous inference provides better throughput comparing same size of batches with however an optimal batch size between 1500 and 5000 (our image sare very small 28*28) in synchronuous then throughput is decreasing is it explainable please?
- is the "number of parallel infer requests" correspond to number of "processing engine" deployed on the chip (does it mean 4 inferences are performed in //)?
- so what is the numbe rof iterations ?
- what is the "total execution time (ms)" because summing read/reshape/latency/first inference doesn't correspond?
- insynchronuous little differences between latency/first inference / total execution is it normal please?
- throughput = 1/total excetuion time * iteration * batch doesn't it?
- is the time necessary to load the images/batch to infer (from somewhere far to the USB port of NS2) not consider that means the images:batch are stored somewhere on the stick before starting the inference?
Thanks a lot for these clarifications very useful to explain our results and perform benchmarking!
fred
- Mark as New
- Bookmark
- Subscribe
- Mute
- Subscribe to RSS Feed
- Permalink
- Report Inappropriate Content
@fredf good evening!
Thank you for using our product and for so much interest in its details.
- as expected asynchronous inference provides better throughput comparing same size of batches with however an optimal batch size between 1500 and 5000 (our image sare very small 28*28) in synchronuous then throughput is decreasing is it explainable please?
AD: batching would be especially beneficial for GPU, while for CPU and MYRIAD batching does not always bring much boost. As I understand, you are using NCS2 and experimenting with streams. This automatically means you are using asynchronous inference. How did you understand that you are running synchronous inferences? Are you experimenting in CLI also? How many inference requests are you using if you run from CLI?
- is the "number of parallel infer requests" correspond to number of "processing engine" deployed on the chip (does it mean 4 inferences are performed in //)?
AD: inference requests do no correspond to processing engines directly. You can run 100 requests on a 4-core device, although that will be far from ideal. Thus it is generally recommended to connect infer requests with the hardware you are using. The processing engine in these terms is better connected with a term of execution stream (that you work with from DL Workbench). Each stream can have several infer requests.
- so what is the numbe rof iterations ?
AD: I am afraid I did not understand that. Could you please clarify?
- what is the "total execution time (ms)" because summing read/reshape/latency/first inference doesn't correspond?
AD: what place in DL Workbench reports the total execution time you are talking about? Could you please paste a screenshot? Is it in the Execution Attributes section?
- insynchronuous little differences between latency/first inference / total execution is it normal please?
AD: I am afraid I did not understand that. Could you please clarify what is "insynchronuous "?
- throughput = 1/total excetuion time * iteration * batch doesn't it?
AD: for asynchronous inference computing throughput analytically would be challenging. By definition, throughput is number of samples that a model processes per time unit.
- is the time necessary to load the images/batch to infer (from somewhere far to the USB port of NS2) not consider that means the images:batch are stored somewhere on the stick before starting the inference?
AD: first inference usually takes more time than consequent runs as it is a generally known hardware aspect - to let it warm up. DL Workbench does not perform any image pre-processing when performing benchmarking experiments, so you get roof-top results. In real-life examples, you will also need to process your data before feeding it into a model which will definitely take some time. However, with means of OpenVINO these costs can be mitigated with asynchronous inference meaning that you have time to process next data piece while you already infer a model on a previous one.
Let me know if that was helpful.
Regards,
Demidovskij Alexander
- Mark as New
- Bookmark
- Subscribe
- Mute
- Subscribe to RSS Feed
- Permalink
- Report Inappropriate Content
Hi Alexander
sorry I should create another reference cause in this case we (with Michael Benguigui who participate now to this discussion) are using the API/Python OV librairies that is why we are able setting the streams, batch size, iterations, registers ,even in asynchronuous but not understanding clearly the way someones are implemented... At the end we let the OV tool setting itself the parameters (except synchronous and asynchronous, and batch size) that corresponds to the last column of the attachment file.
In all cases it looks that the stream 2 was selected without a significant impact on throughput but on eon the latency in asynchronous is it normal please?
We confirm in asynchronous: throughput = 1/(total execution time / (iteration nbre* batch size) that is why this deterministic calculation is strange. In synchronous same calculation also equal to 1/(latency/batch size). Indeed it looks that latency is for th ebatch so we have to divide it by 5037 to retrieve the same valeu than the throughput (once inverted) that is apparently for one image is it right please?
The question about image access is not from pre processing point of view (of course included in the NN or performed on th eimage before submitting it in inference, but the process to read the image somewhere on the machine/server that could be distant from the stick so does this tyime take into acount somewhere cause it is different for each configuration or does the timing correspond to the inference once the image is loaded on the NS2?
In the last tab we try to summarise the best results but we are sure of our interpretation plese could you check? We test only the NS2 in this case.
Thanks again!
fred
- Mark as New
- Bookmark
- Subscribe
- Mute
- Subscribe to RSS Feed
- Permalink
- Report Inappropriate Content
Hi fredf,
Sorry for delay. We have checked your model. There is indeed a limitation in DL Workbench with visualizing a binary semantic segmentation models. Thank you for reporting this problem.
- Mark as New
- Bookmark
- Subscribe
- Mute
- Subscribe to RSS Feed
- Permalink
- Report Inappropriate Content
Thank you as suspected it is a limitation of the tool,
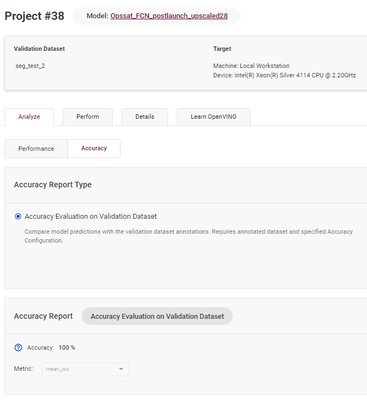
so please how I can evaluate the inferences/metrics using OV tool (for instance on the images in the dataset seg_2) cause the function "Accuracy" provides a strange result (100% not possible on segmentation) but I don't which images are used please?
- Mark as New
- Bookmark
- Subscribe
- Mute
- Subscribe to RSS Feed
- Permalink
- Report Inappropriate Content
Hi,
Accuracy measurement provides such a strange result because accuracy validation was not configured properly. In basic mode 'Configure Accuracy Validation' page can provide settings only for preconfigured default scenarios. There is an option for semantic segmentation but it is a multi class semantic segmentation. As we investigated above your model has limitation in DL Workbench as it is a binary model.
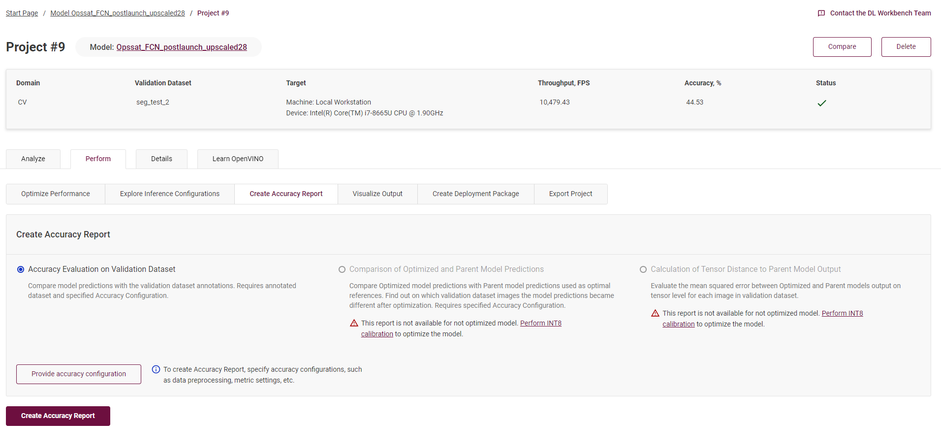
There is however an option to provide a custom accuracy settings for your model in an advanced mode of 'Configure Accuracy Validation' page.
Could you please try to follow next steps:
1. Open 'Configure Accuracy Validation' page. At you project page navigate to 'Perform' -> 'Create Accuracy Report' -> 'Provide accuracy configuration'. After clicking on 'Provide accuracy configuration' you will be redirected to 'Configure Accuracy Validation' page.
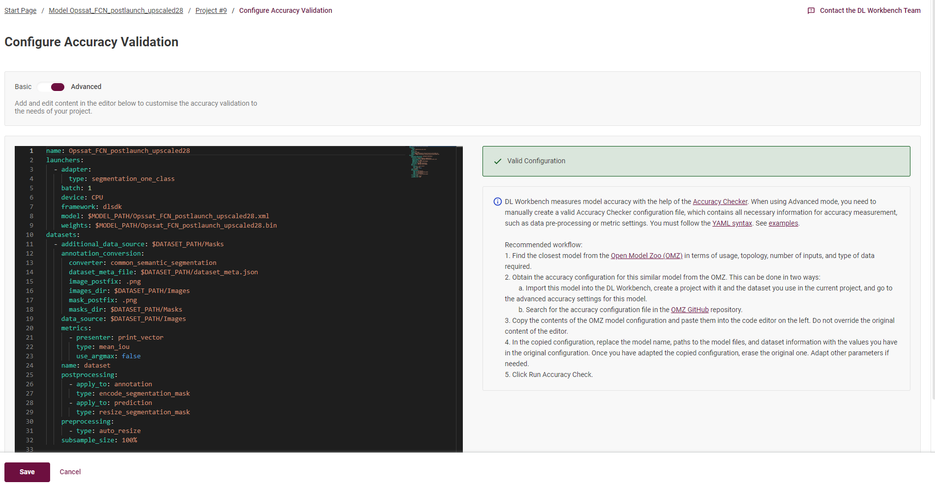
2. At 'Configure Accuracy Validation' switch to advanced mode.
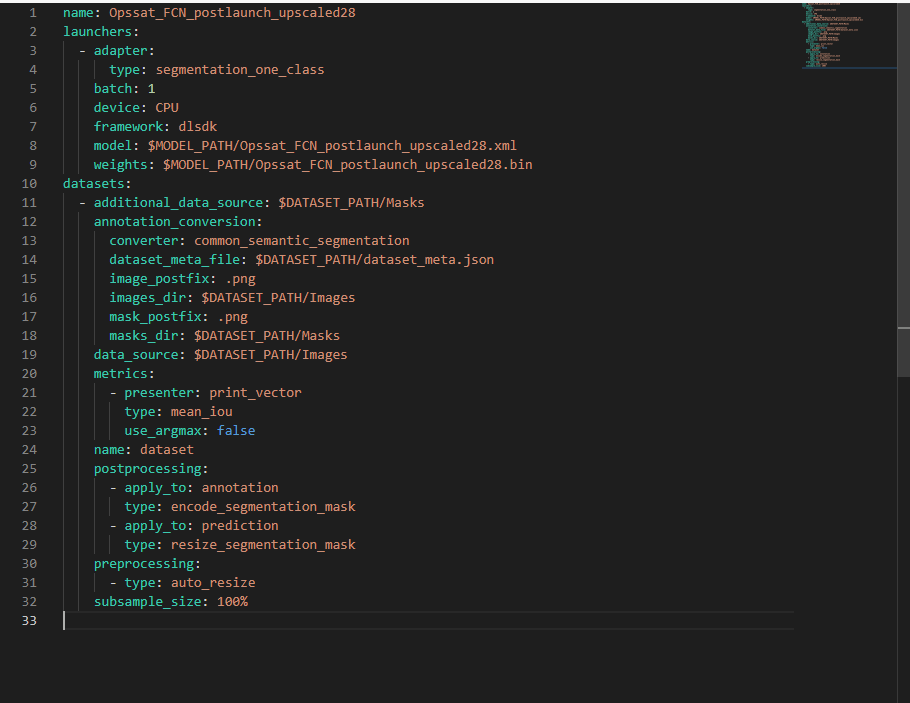
3. Configuration should look similar to below. Manually change fields:
- launchers.adapter.type = segmentation_one_class
- datasets.annotation_conversion.image_postfix = .png
- datasets.metrics.use_argmax = false
4. Click 'Save', Click 'Create Accuracy Report'
Please let me know if you have any issues following instructions.
We also continued investigation of you model and it seems not to work properly in openvino format. On you test images from dataset model gives raw results in range from 0 to 1e-5 which tells that model doesn't detect anything.
Could you confirm that model is working in original framework as expected?
If yes can you please provide us with the following information:
1. Preprocessing configuration in original format
2. How did you exported model to onnx format
- Mark as New
- Bookmark
- Subscribe
- Mute
- Subscribe to RSS Feed
- Permalink
- Report Inappropriate Content
Thanks a lot now the resulting accuracy is no more 100% :
- mean_accuracy / semantic_accuracy / frequency_weighted_accuracy = 91.25%
- mean_iou = 46%
No detail on the way are calculated these two metrics but it is quite strange to get so difference between mean IOU and accuracy, do you have an explanation please?
Is this metric report calculated on the full dataset (id est ten thumbnails)? So considering the vizualisation doesn't work on this network how I can please infere (and get the metric) on one image only (except by creating a dataset including only this image)?
About you rquestions, I confirm this model is working also on other AI boards:
1. only /255 on the three bads is applied as preprossing (and included in this IR model)
2. quite complicate cause this NN was trained on TF (H5 format), then modified (last layer) and converted to ONNX with Matlab...
Bye
fred
- Mark as New
- Bookmark
- Subscribe
- Mute
- Subscribe to RSS Feed
- Permalink
- Report Inappropriate Content
Hi,
Metrics computation formulas are described in Fully Convolutional Networks for Semantic Segmentation in chapter 5. OpenVINO Accuracy Checker implementation can be found here.
We found that dataset_meta.json should looks like this as your mask is also binary:
{
    "label_map": {"0" : "no-cloud", "1" : "cloud"},
    "background_label":"0",
    "segmentation_colors":[[0], [255]]
}
We also found that 2 of 10 images are in '.jpg' format and that's why your accuracy report was calculated on 8 '.png' images only.
Could you please provide us with the version of DL Workbench you currently using? It seems that the version you using has no support for per image accuracy measurements.
The 2021.4.2 version of DL Workbench introduced a per image level of accuracy report with an ability to visualize a single image:
Regarding the model correctness: as I mentioned the model doesn't seems to work properly, so accuracy measurements and visualization wouldn't provide a valid results. Could you please provide us with the model in ONNX format so we would try to investigate it further?
- Mark as New
- Bookmark
- Subscribe
- Mute
- Subscribe to RSS Feed
- Permalink
- Report Inappropriate Content
Sorry about the mistakes in the dataset (corrected one in the attachment)
You should be right we didn't upload the WB version since a long time (currently 1.0.3865.845938c6) so we can try again with the last one on the corrected dataset...
Please find in attachement the ONNX (that is created from an H5 model with modified output) under zip format cause .onnx is not accepted...
Did you have received please the question about the "HW metrics" hereabove (03-22-2022 04:58 PM)?
Thanks again for your useful help!
fred
- Mark as New
- Bookmark
- Subscribe
- Mute
- Subscribe to RSS Feed
- Permalink
- Report Inappropriate Content
Hi,
Thank you for sharing model in ONNX format, please give us some time to investigate.
Regarding your question about 'HW metrics' - sure we received it. As it is related to underlying tools it will take a bit more time to answer. Sorry for delay.
- Mark as New
- Bookmark
- Subscribe
- Mute
- Subscribe to RSS Feed
- Permalink
- Report Inappropriate Content
No problem Alexander I understand however if you can please clarify first the easier "HW metrics" on beginning of next week it will be very kind because we are benchmarking several deployments,
Thanks fred
- Mark as New
- Bookmark
- Subscribe
- Mute
- Subscribe to RSS Feed
- Permalink
- Report Inappropriate Content
Hi Alexander, please find in attachment another file with performances results better structured taht allows comparing the same NN with inferences synchro and asynchro on single image and large batch (5037 thumbnails corresponding to a full image):
- in synchro mode the inference time are identical comparing latency and 1/throughput even on large batch dividing the latency by the number of images in the batch considering the throughput is for one image is it right?
- in asynchronuous mode the interpretation is obviously more complicate but as expected the benefit is higher on throughput, latency is lower comparing asynchronous one with same batch size but with BS=1 image the benefit is very limited/not significant is it normal please?
- about the stream parameter an error occures since 4, no significant impact on BS=1 image, stream=2 is better than stream=3 in synchronuous BS=5037, and the latency is directly impacted by the stream factor in asynchronous with BS=1 (latency with Stream=3 is 3 times the latency with stream=1) so the question remains on the stream: is it a partioning of the NS2 to deploy in parallel the NN inferences please?
Thank you for these clarifications
fred
- Mark as New
- Bookmark
- Subscribe
- Mute
- Subscribe to RSS Feed
- Permalink
- Report Inappropriate Content
Hi,
We checked your model in .onnx format and it doesn't seems to work correctly. This is out results:
Input image:
Expected mask:
Actual mask:
Actual tensor - attached as onnx_out.txt (all values are 0).
We could recommend you to try supported in DL Workbench tensorflow .savedmodel format directly without converting it to onnx.
- Mark as New
- Bookmark
- Subscribe
- Mute
- Subscribe to RSS Feed
- Permalink
- Report Inappropriate Content
Ok you are right I will train it again with the right output layer to avoid changing layer... But in your attachement onnx-out.txt all values are null does it correspond to segmentation map please ?
Besides is it possible to access to weights/biases values of the IR models once converted please?
Have a nice WE
fred
- Mark as New
- Bookmark
- Subscribe
- Mute
- Subscribe to RSS Feed
- Permalink
- Report Inappropriate Content
Hi,
Yes it is corresponds to an actual(predicted) segmentation map - all pixels are black which is represents a 0 values in onnx-out.txt file.
Yes, it is possible to access weight/biases values of the IR model via Python API. Here is a simple example:
from openvino.runtime import Core
core = Core()
model = core.read_model('./squeezenet1.1.xml')
layer_id = 1
model.get_ordered_ops()[layer_id].get_data()
- Mark as New
- Bookmark
- Subscribe
- Mute
- Subscribe to RSS Feed
- Permalink
- Report Inappropriate Content
Dear Alexander... like Fred, I would need more precision of how to retrieve the exact processing time for a single image (latency according to Intel terminology?). The benchmark_app.py script displays multiple metrics, and In some situations (BS>1 + Async) the "latency" seems hard to understand. Here is an example of a benchmark output
topology;Best_model_CNN_KVacc0.841899037361145_Bsize8Patience_5K.h5with1batch__28x28__v10
target device;MYRIAD
API;async
precision;UNSPECIFIED
batch size;5037
number of iterations;0
number of parallel infer requests;6
duration (ms);60000
number of MYRIAD streams;3
Execution results
read network time (ms);4.13
reshape network time (ms);0.72
load network time (ms);2035.16
first inference time (ms);2312.47
total execution time (ms);72939.46
total number of iterations;48
latency (ms);9039.85
throughput;3314.75
In that case, we found that :
1/throughput = 1/3314.75 = total_exec_time/(number_iterations*batch_size) = 72.939/(48*5037)
But we cannot understand the latency value.. Is there any magic formula to correlate these metrics ?
++
- Subscribe to RSS Feed
- Mark Topic as New
- Mark Topic as Read
- Float this Topic for Current User
- Bookmark
- Subscribe
- Printer Friendly Page
